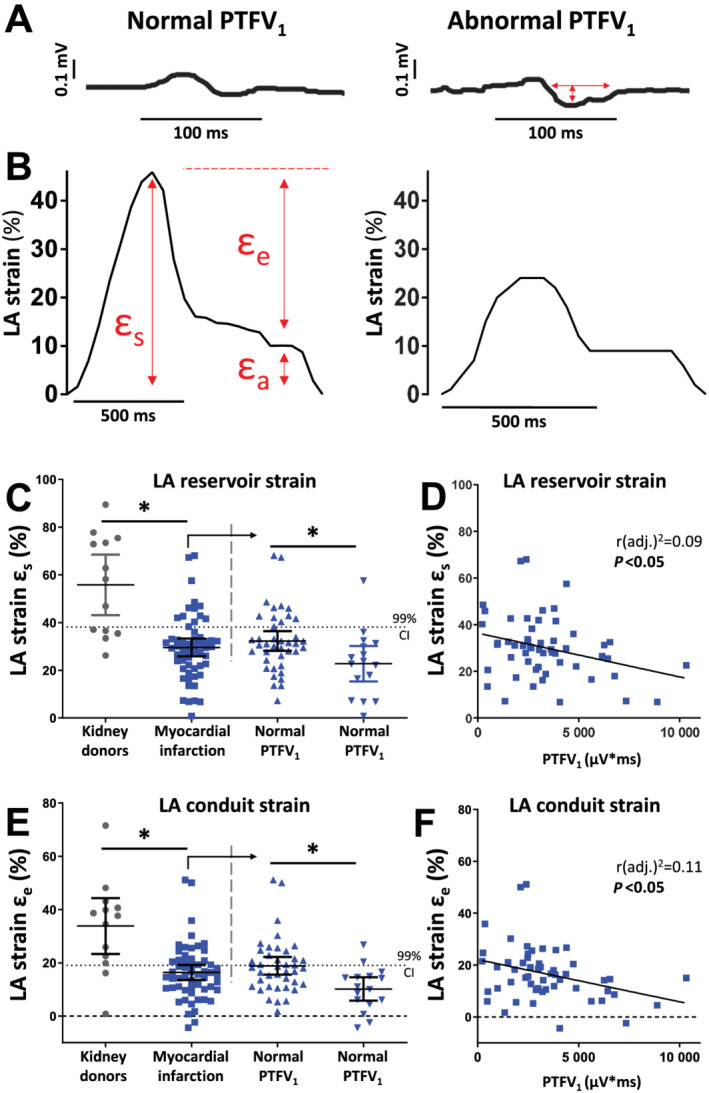
Figure 1.

An abnormal PTFV1 indicates reduced atrial function. (A) Tracing of an ECG and LA strain in a patient with normal and abnormal PTFV1. Red arrows indicate measured values. PTFV1 is calculated as the product of the duration and depth of the negative deflection of biphasic P‐waves in the precordial ECG lead V1. (B) CMR feature tracking tracings of global longitudinal strain of the LA are used to calculate atrial strain parameters for reservoir (εs) and conduit (εe) function. (C–F) Left atrial reservoir and conduit function for the kidney donors (n = 13, grey dots) and the myocardial infarction group (n = 56, blue squares); the dotted line represents the lower 99% CI of the kidney donors; the myocardial infarction group is further divided in normal and abnormal PTFV1. (C) Left atrial reservoir function strain. (D) Correlation of PTFV1 and LA reservoir strain. (E) Left atrial conduit function strain. (F) Correlation of PTFV1 and LA conduit strain. CI, confidence interval; LA, left atrial; PTFV1, P‐wave terminal force V1; ε, strain. *P < 0.05, Student's t‐test. Exact values of means and P‐values are listed in Supporting Information, Table S2 .
