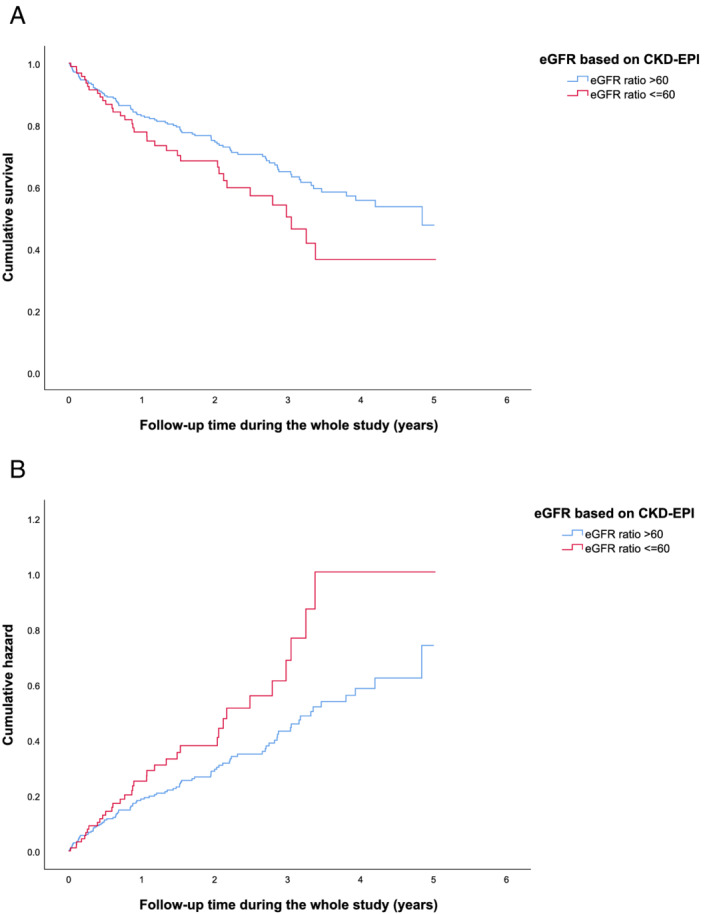
Figure 2.

(A) Kaplan–Meier survival curves for patients with Shrunken pore syndrome (SPS) (eGFRcystatin C/eGFRcreatinine ratio ≤ 0.6) (red) and patients with an eGFRcystatin C/eGFRcreatinine ratio > 0.6 (blue), during the follow‐up time. SPS is calculated based on CKD‐EPI formulas. (B) Cumulative hazard for the patients with SPS (red) and patients with an eGFRcystatin C/eGFRcreatinine ratio > 0.6 (blue), during the follow‐up time. Calculations are based on CKD‐EPI formulas. CKD‐EPI, Chronic Kidney Disease Epidemiology Collaboration; eGFR, estimation of glomerular filtration rate.
