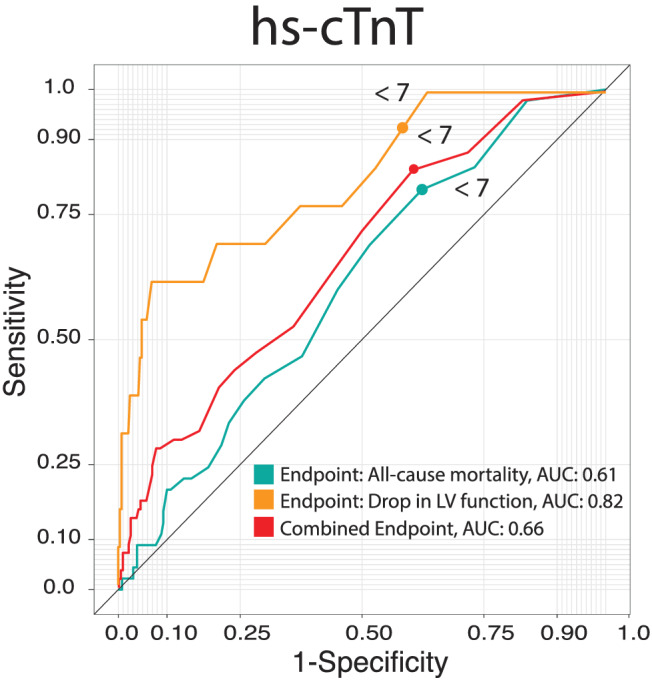
Figure 3.

ROC curves showing the predictive value of hs‐cTnT on the endpoints all‐cause mortality (ACM), drop in left ventricular (LV) function and the combined endpoint (ACM and drop in LV function). Area under the curve (AUC) as indicated. Hs‐cTnT, high sensitivity cardiac troponin T.
