
Figure 3. Whole Lung Cellular Distribution.
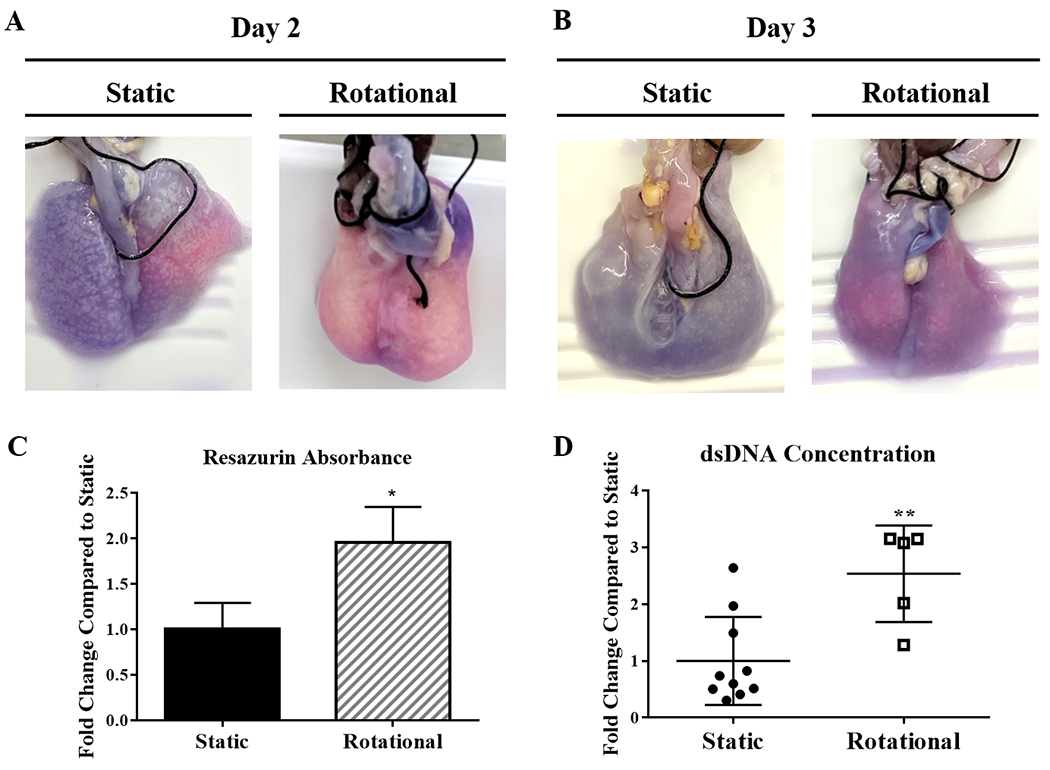
Images of reseeded lungs after resazurin perfusion at day 2 (A) and day 3 (B). Pink regions show areas with more cellular activity and dark blue/purple areas with fewer cells. Quantification of resazurin absorbance from each set of lungs after 3 days of culture (C). After 3 Days (D), dsDNA quantification compares the concentration distribution between static to rotationally seeded lungs. Each circle or square represents a concentration from either an anterior or posterior portion of each lung. All lungs but one had more than two regions within one lung represented within the data. Data are presented as mean +/− standard deviation from 3 reseeded lungs. *, ** indicates p < 0.05, p< 0.01 respectively.