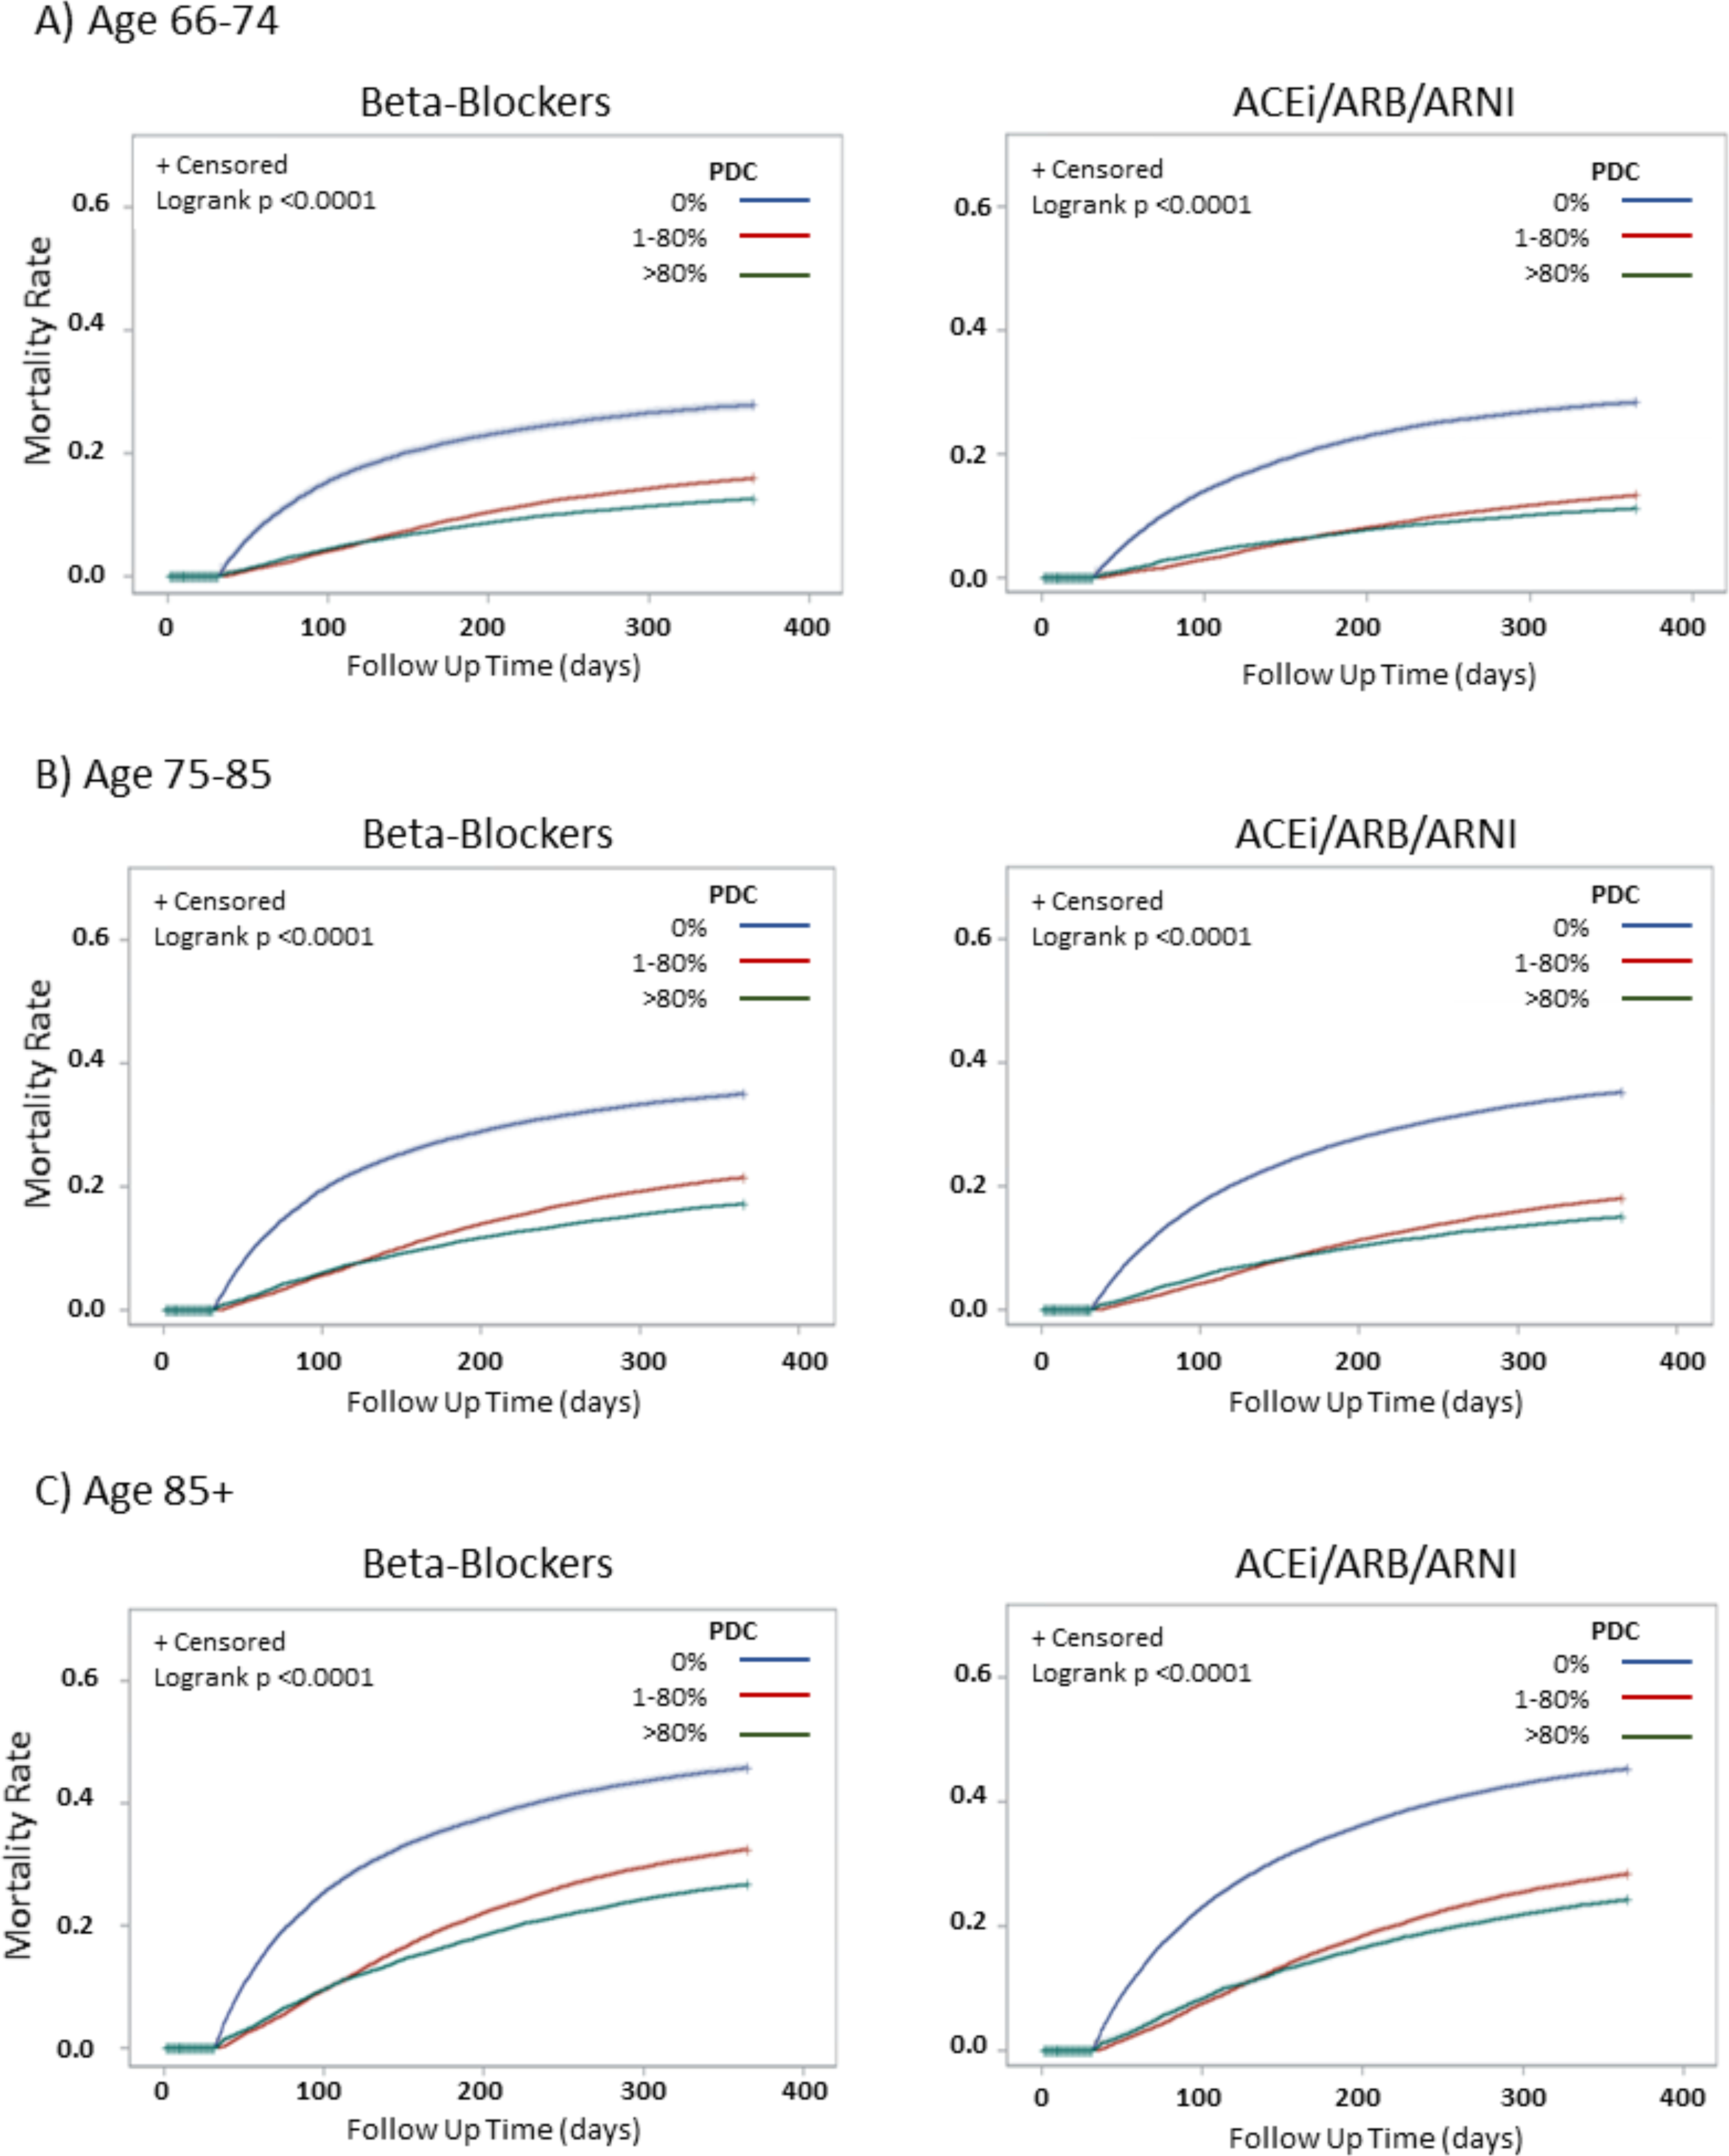
Figure 1: Survival Curves for Death within 1 Year* after Hospital Discharge based on Beta-Blocker and ACEi/ARB/ARNI Exposure, Stratified by Age, 2008–2015.

* Conditional on survival to 30 days after discharge.
This figure shows the Kaplan Meier curves for 1-year time to death, by age, based on exposure to beta-blockers (left side) and ACEi/ARB/ARNI (right side). Row 1 (A) shows the survival curves for beneficiaries aged 66–74. Row 2 (B) shows the survival curves for beneficiaries aged 75–85 and Row 3 (C) shows the survival curves for beneficiaries aged 85+. In each panel, patients are stratified by the proportion of days covered (PDC) by relevant drug: “no exposure” 0 PDC, “moderate” exposure 1–80 PDC and “high exposure” 80+ PDC.
