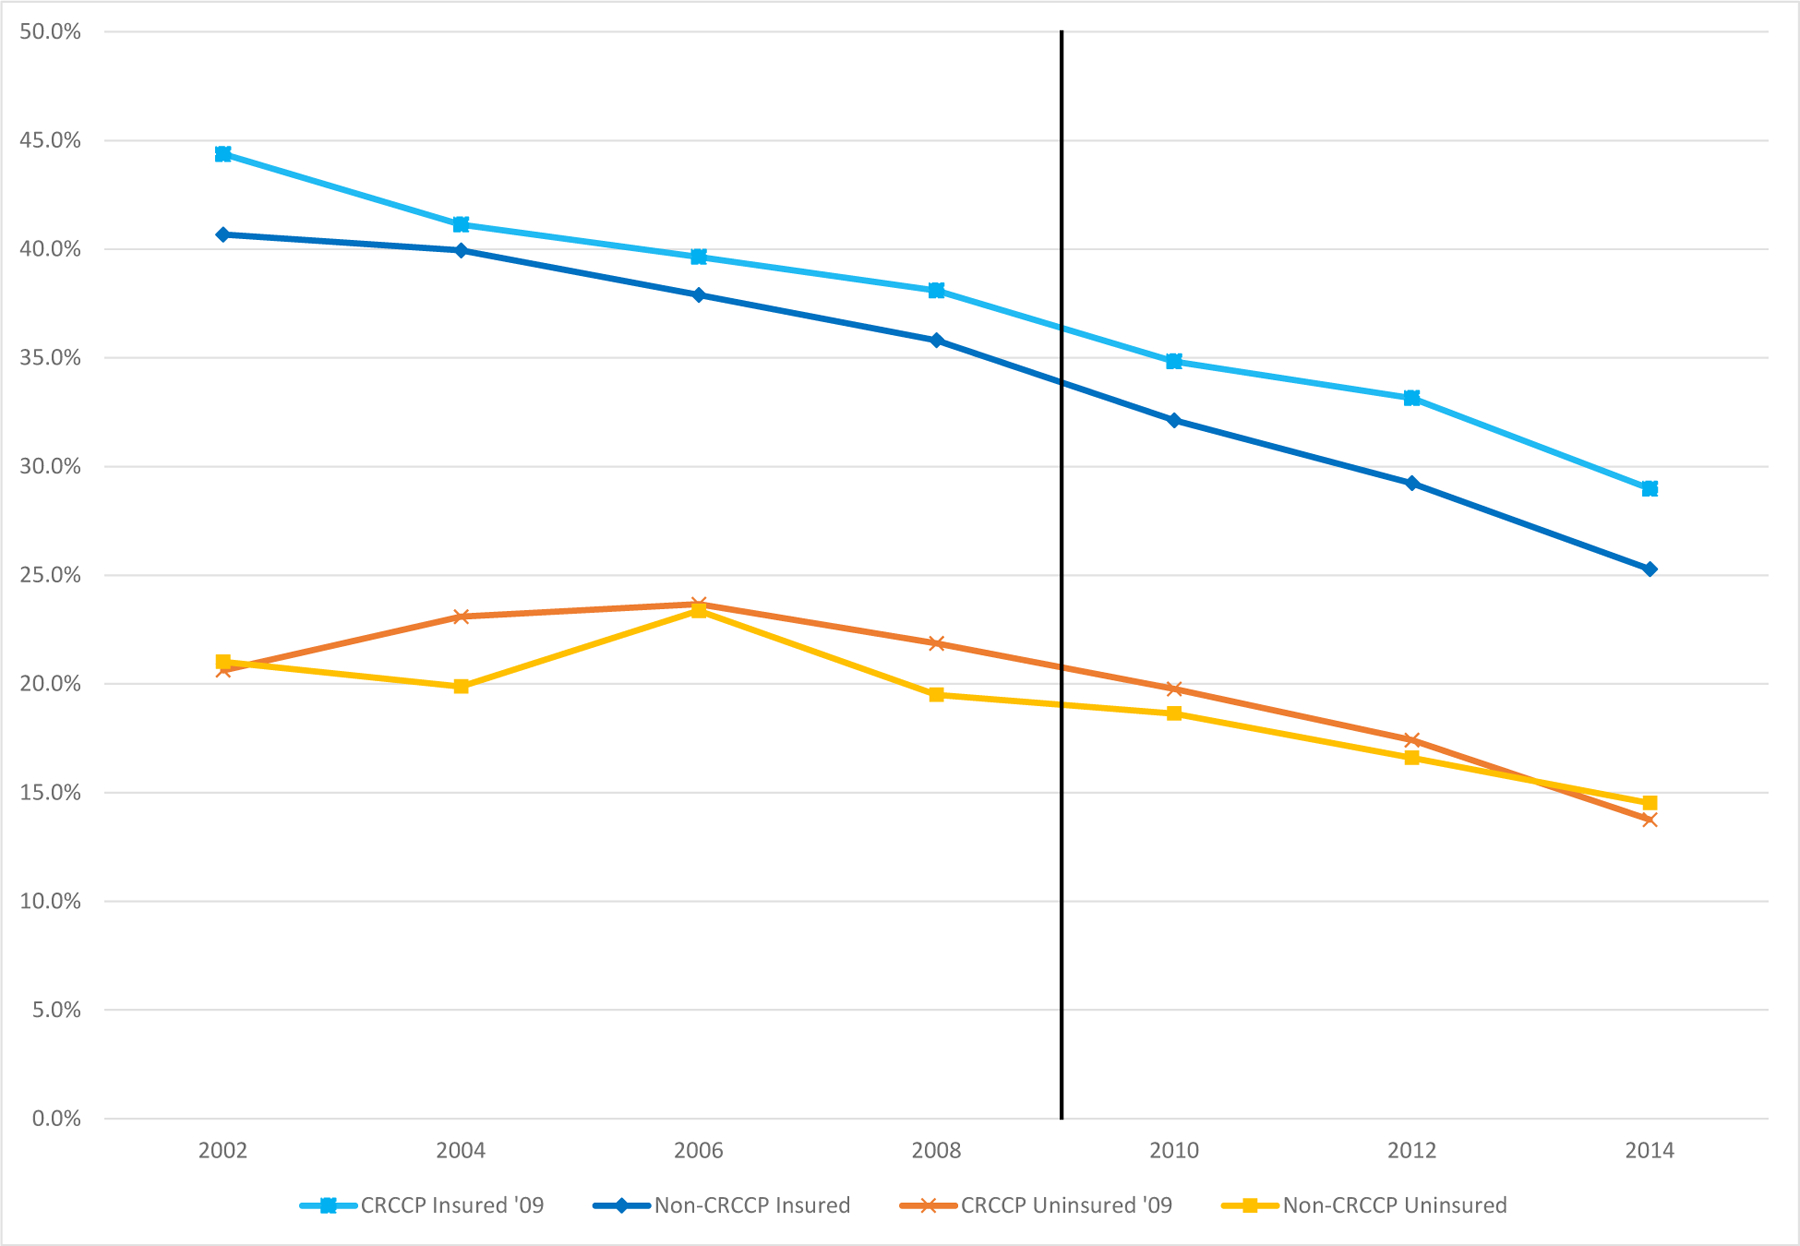
Figure 2. Trends in the Probability an Individual Ever had a Fecal Occult Blood Stool Test, by Insurance Status and Whether State Participated in CRCCP.

50–64-year-old men and women, 2002–2014 BRFSS (even years only)
Notes: The figure shows means for ever having had FOBT in even years by whether or not the state adopted CRCCP in 2009/2010 and by insurance status, using BRFSS data for 2002–2014 for 50–64 year olds. The orange line with cross hatches represents means for the uninsured 50–64-year olds in states who adopted CRCCP in 2009 or 2010, the yellow line with square markers represents means for the uninsured in states which never adopt CRCCP during 2002–2014. The light blue line with square markers represents means for those 50–64-year olds with insurance who adopted CRCCP in 2009/2010 and the darker blue line with diamond markers represents means for the insured in states which never adopt CRCCP during 2002–2014. Means are weighted to be population representative.
