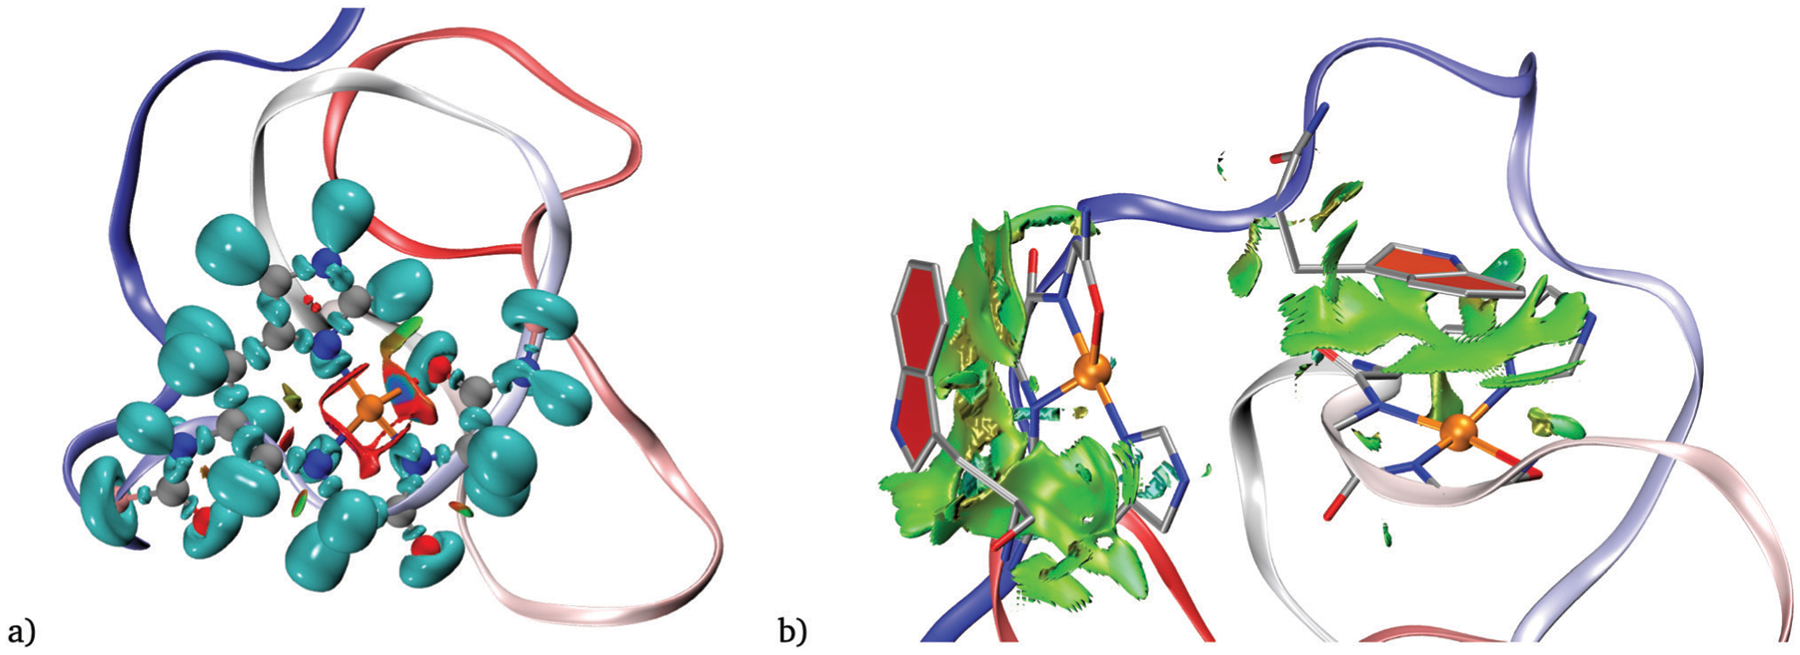
Fig. 10.

(a) NCI and ELF plot for one coordination site at the structure with the minimum average distance of model 1. The isovalues are 0.82 and 0.6 for the ELF and NCI analysis, respectively. (b) NCI analysis to show copper-tryptophan interactions between TRP from OR 4 with Cu1 (left) and TRP from OR 1 with Cu3 (right). Only sign(λ2)ρ values between −0.02 and 0.01 are displayed. The RDG isovalue is 0.6.
