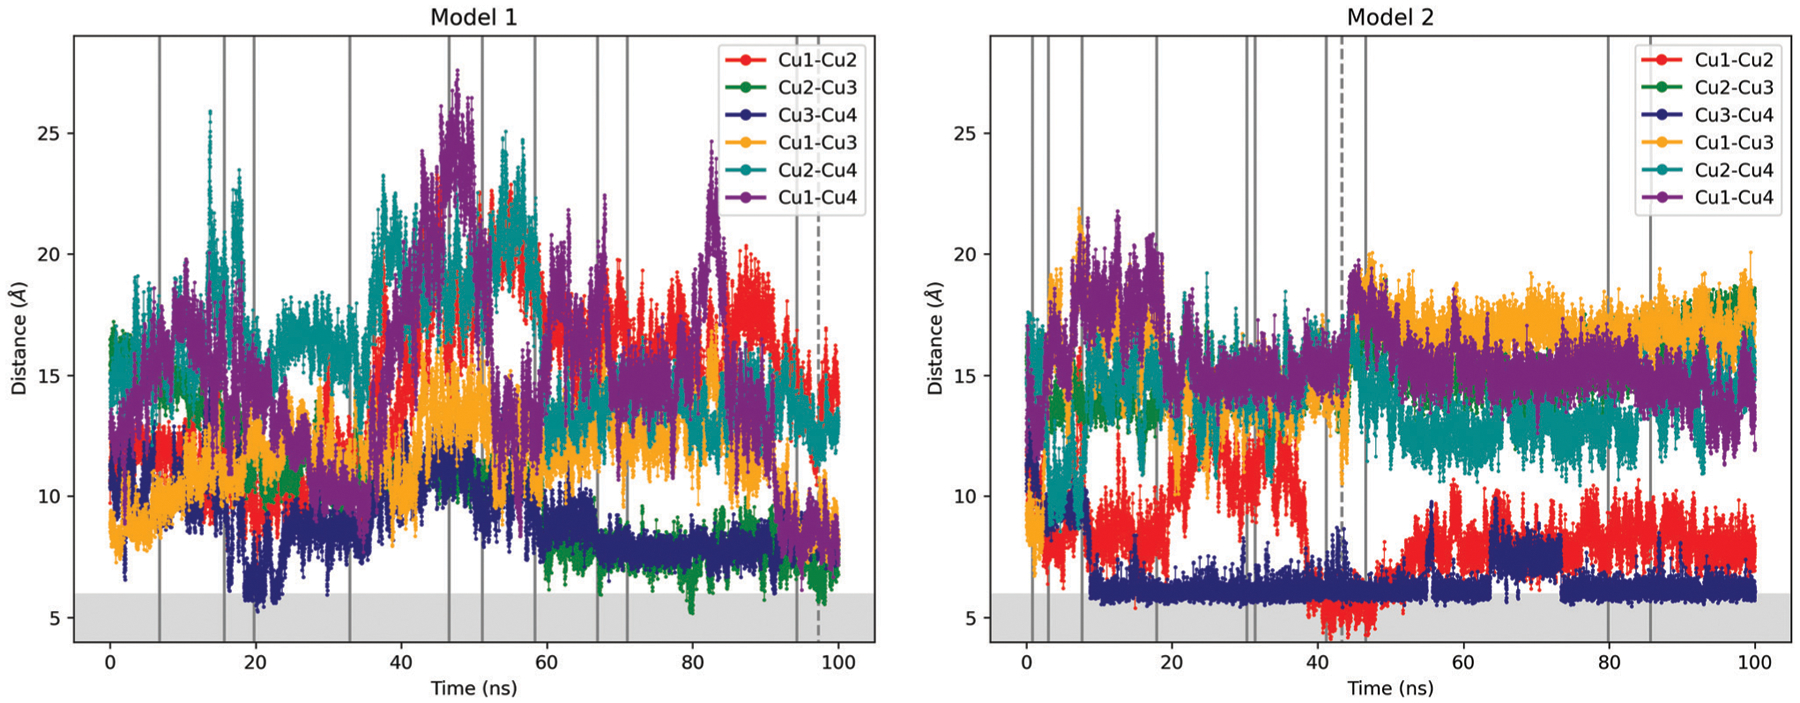
Fig. 5.

Distances between copper ions in models 1 (left) and 2 (right). The vertical lines indicate the representative points according to the k-means analysis. The dashed line indicates the minimum of the average of the distances. The shaded area indicates distances less than 6 Å. The labeling of the coppers corresponds to the Fig. 1.
