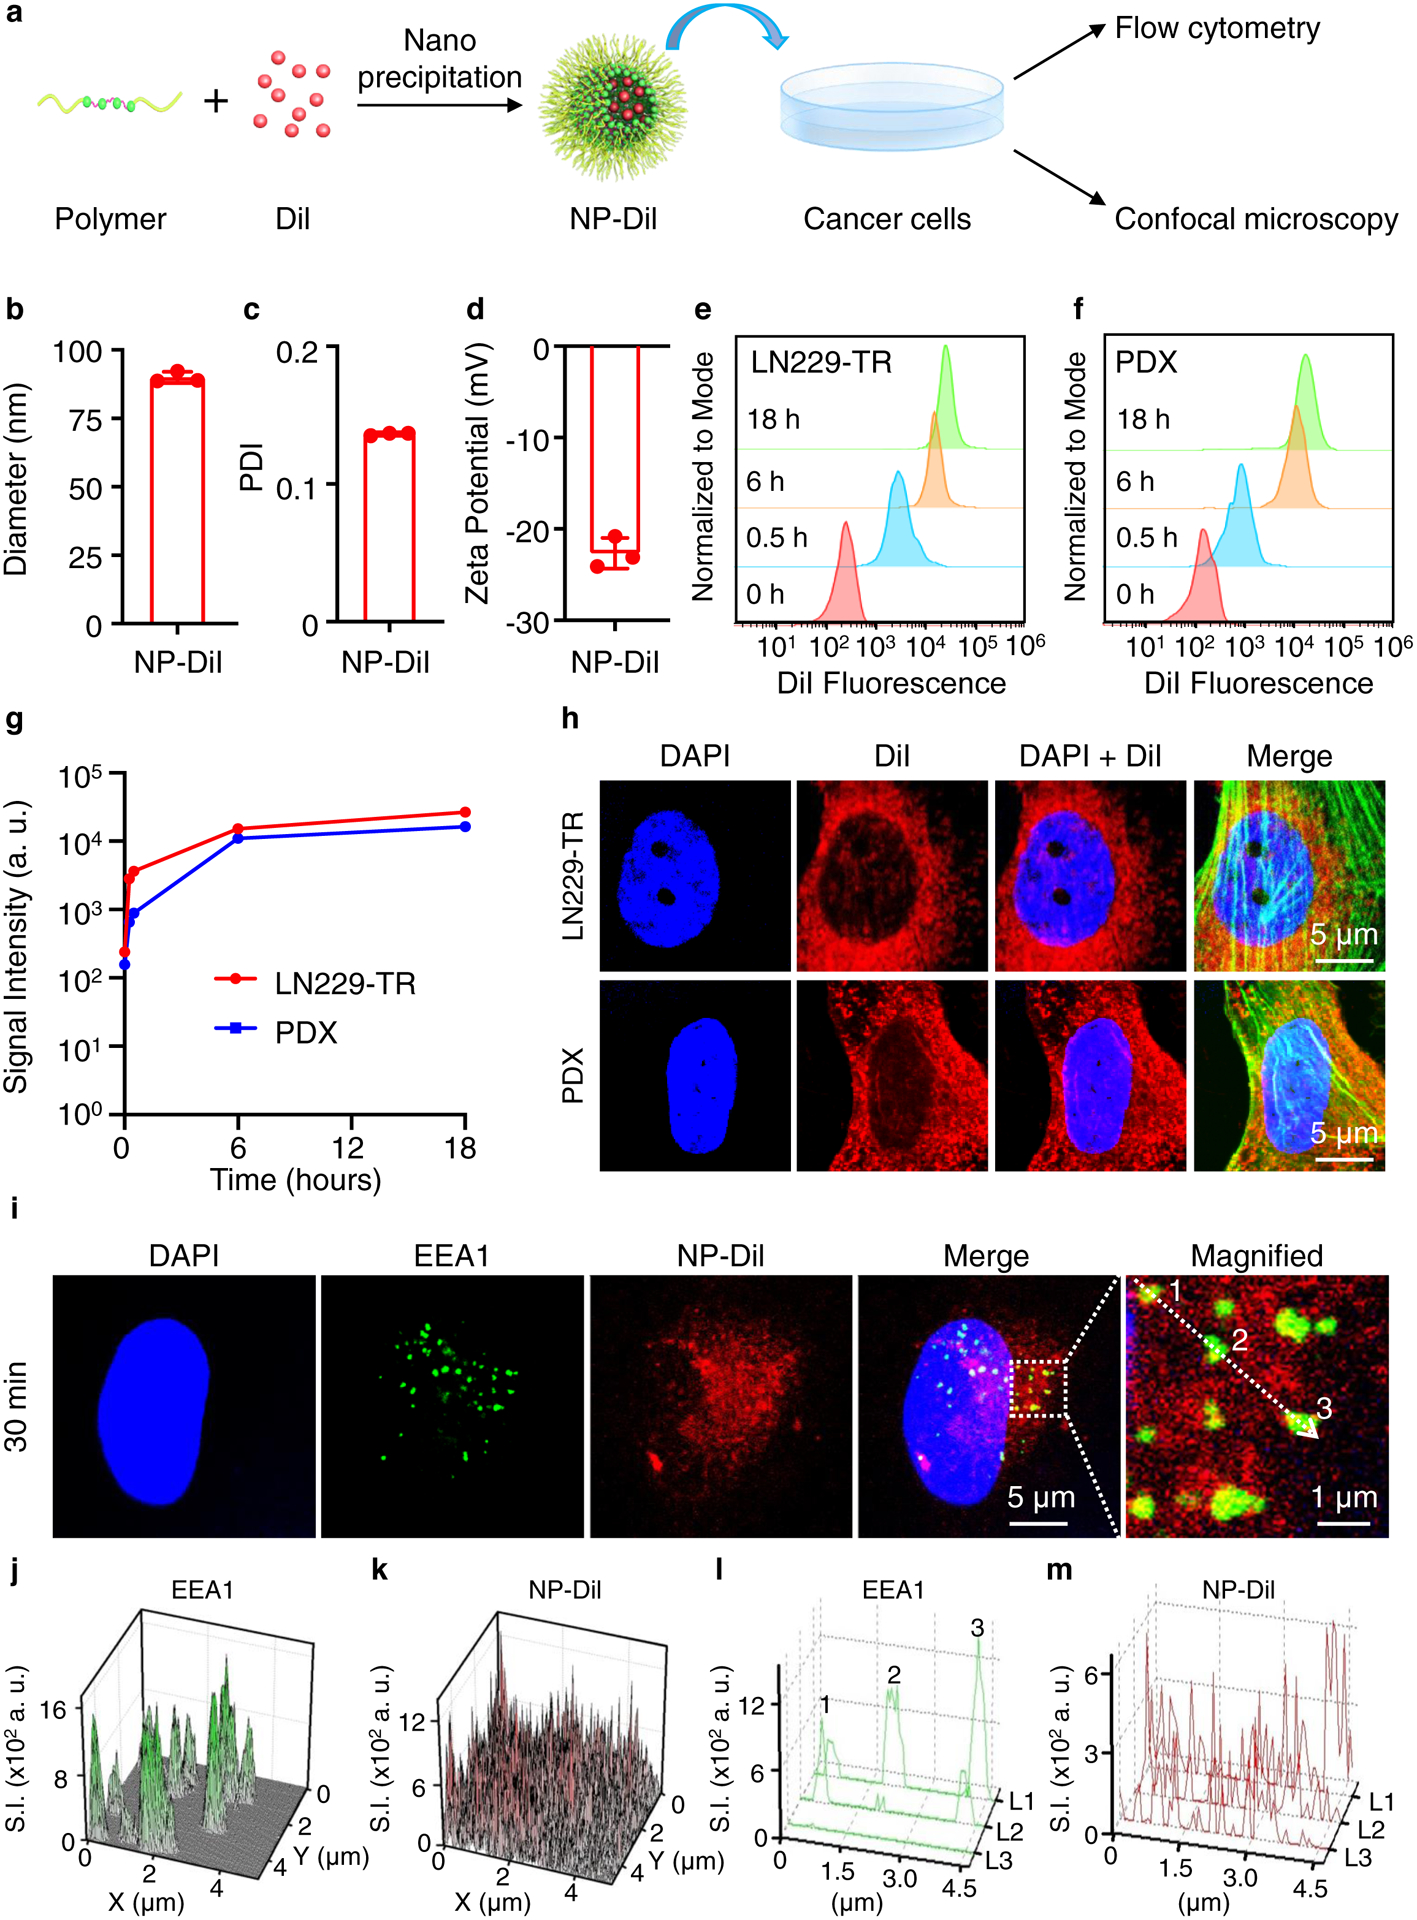
Figure 3 |. Intracellular uptake of dye-loaded NPs.

a, Schematic of experimental procedure. b-d, Characterization of NPs containing DiI (NP-DiI), including the hydrodynamic diameter (b; mean=90 nm), PDI (c; mean=0.14) and zeta potential (d; mean=−23 mV). n=3, data are mean ± s. d. e, f, The intracellular uptake of NP-DiI by LN229-TR (e) and PDX (f) measured by flow cytometry. The mean fluorescence intensity of the cells increases over time. n=3, data are mean ± s. d. g, Quantification of mean fluorescence intensity over time. h, NP-DiI NPs exhibit perinuclear localization in both LN229-TR cells and PDX cells 12 hours after incubation. F-actin is labelled with a phalloidin antibody (green). Scale bars, 5 μm. i-m, Subcellular localization of NP-Dil. LN229-TS cells are stained with early endosome antigen 1 (EEA1) antibodies. The spatial signal in the dashed square in i is quantified and presented in j (EEA1) and k (NP-DiI). The signal along the dotted arrow in i is measured and plotted in l (EEA1) and m (NP-DiI). L1, L2 and L3 refer to image layers 1, 2 and 3 from confocal imaging.
