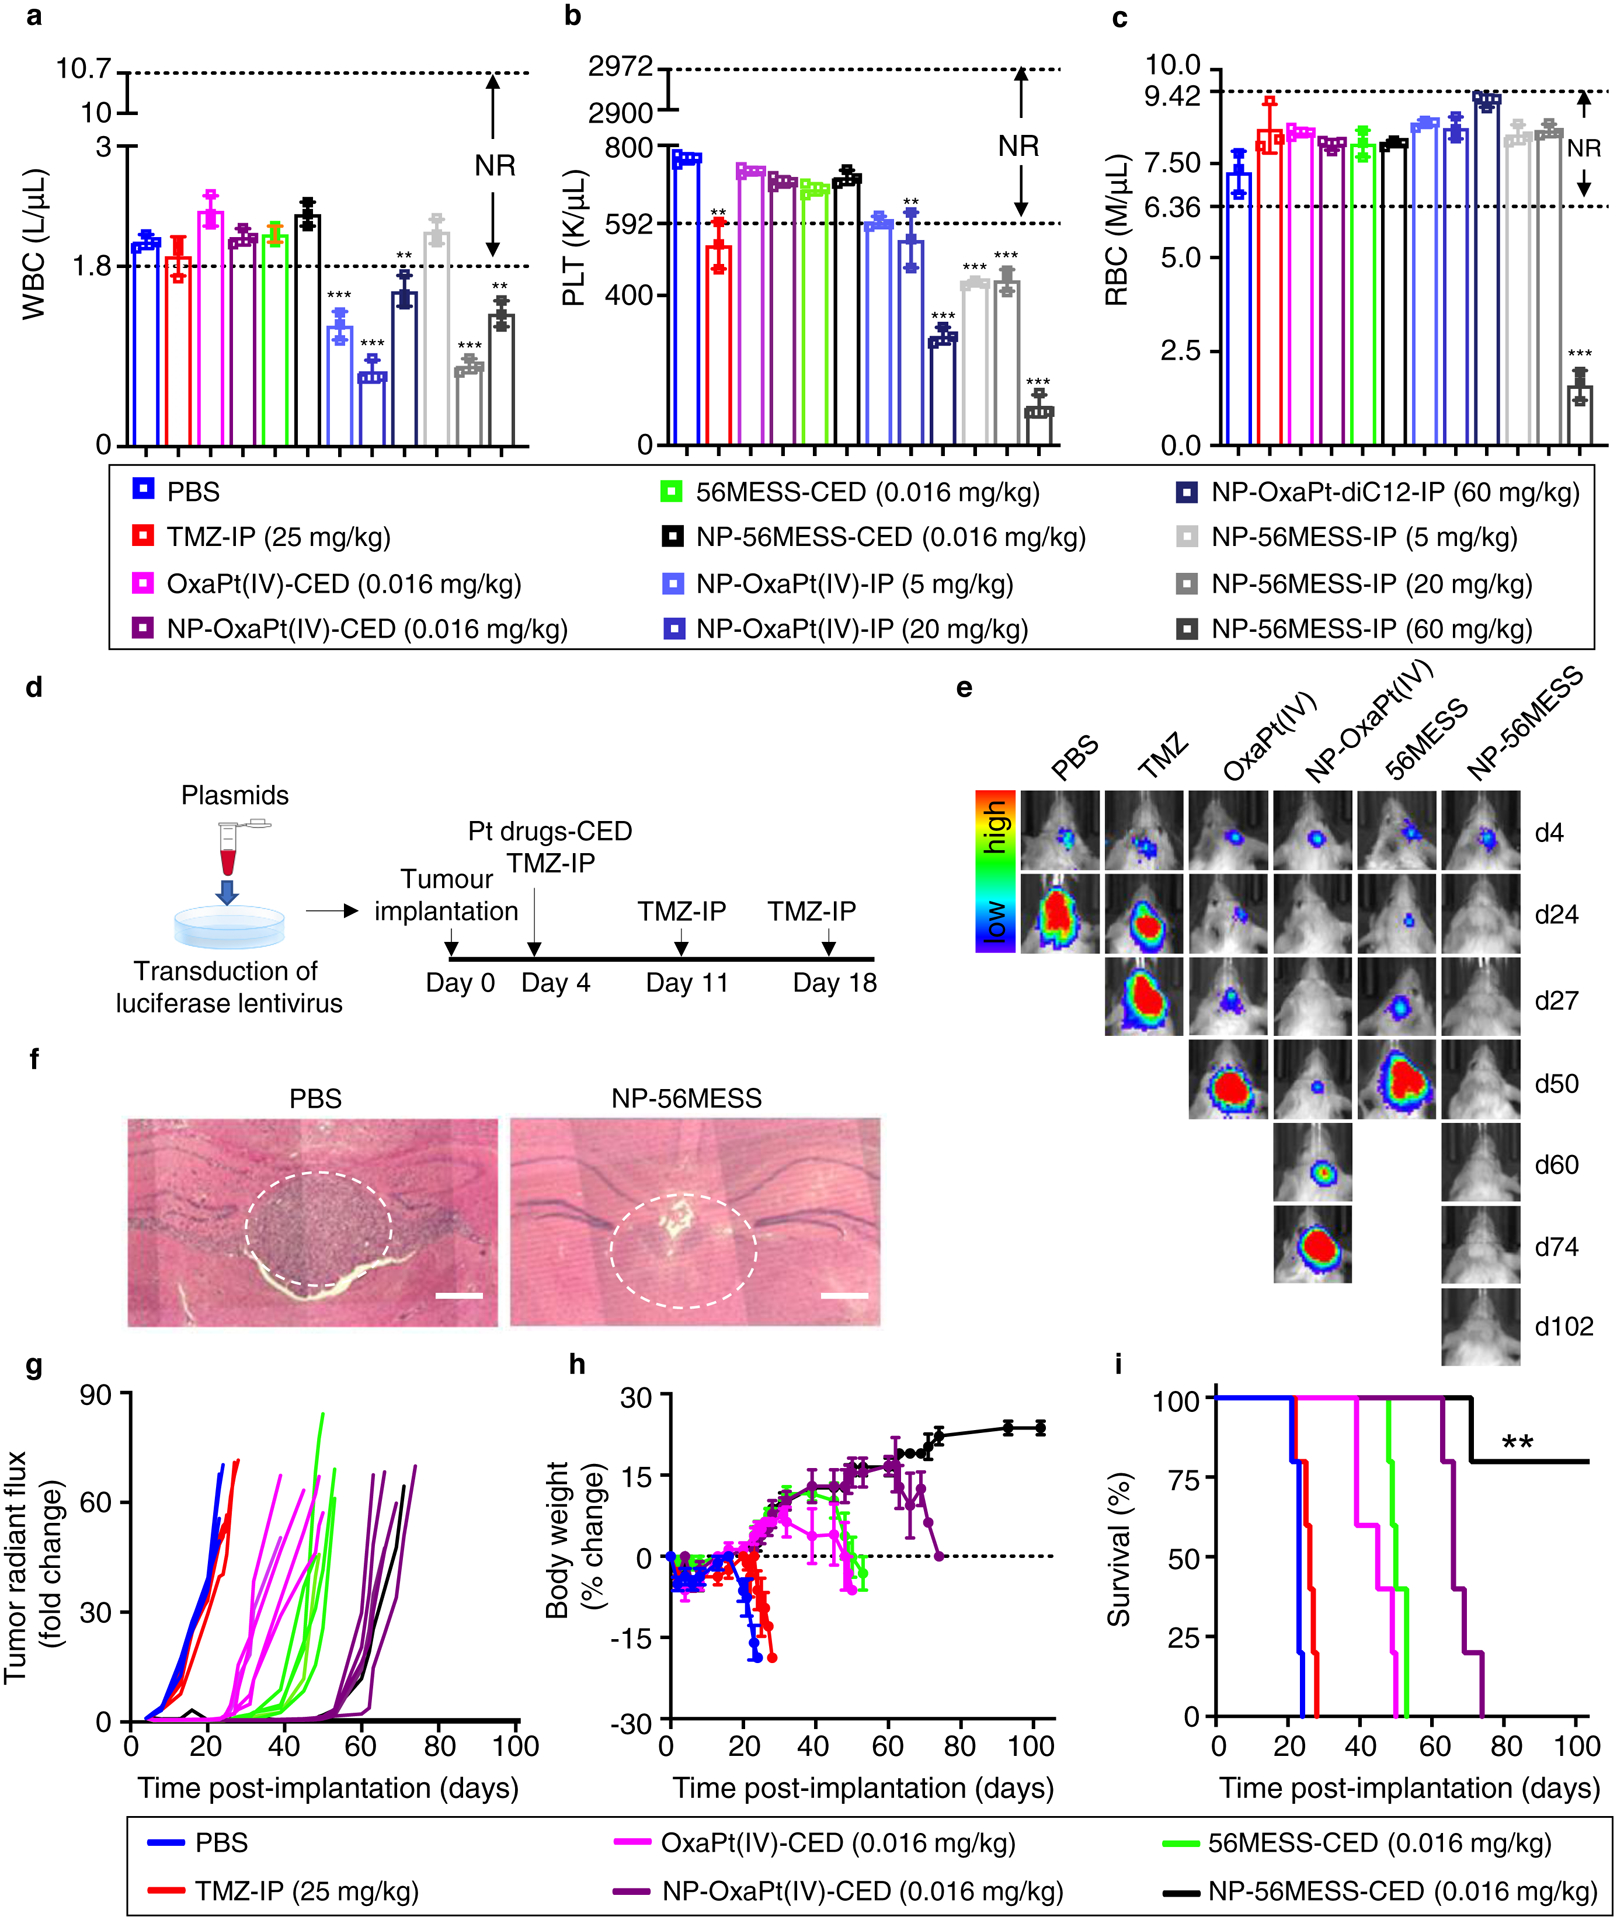
Figure 5 |. Antitumour efficacies of NP-OxaPt(IV) and NP-56MESS in mice bearing LN229-TR-LUC tumours.

a-c, Intraperitoneal injection (IP) of NPs led to reduction in white blood cells (a), platelets (b), and red blood cells (c), whereas the numbers of these cells were in the normal range (NR) in CED groups. K μl−1, thousand per microliter. M μl−1, million per microliter. n=3 biological replicates, data are mean ± s. d. Differences among the PBS group and the treatment groups with out-of-range values are assessed by unpaired t-tests. **P < 0.01, ***P < 0.001. d, Schematic of treatment schedule. e, Bioluminescent IVIS images of representative mice. Five mice are used for each treatment group (n=5 biological replicates). f, Haematoxylin and eosin images of brain tissue from the PBS group (left) and from a long-term survivor of the NP-56MESS group (right). The white dotted circles show tumour sites. Scale bars, 250 μm. g, Changes in bioluminescence signal from the baseline (day 4). The concentrations of NP groups represent the concentrations of OxaPt(IV) or 56MESS; that is, encapsulation efficiencies are taken into account. h, Changes in the body weight compared with baseline (body weight at day 0). Data are mean ± s. d. i, Survival of mice bearing LN229-TR-LUC cells. The NP-56MESS-CED group displays a statistically significant improvement in survival compared with other groups (**P < 0.01, log-rank test).
