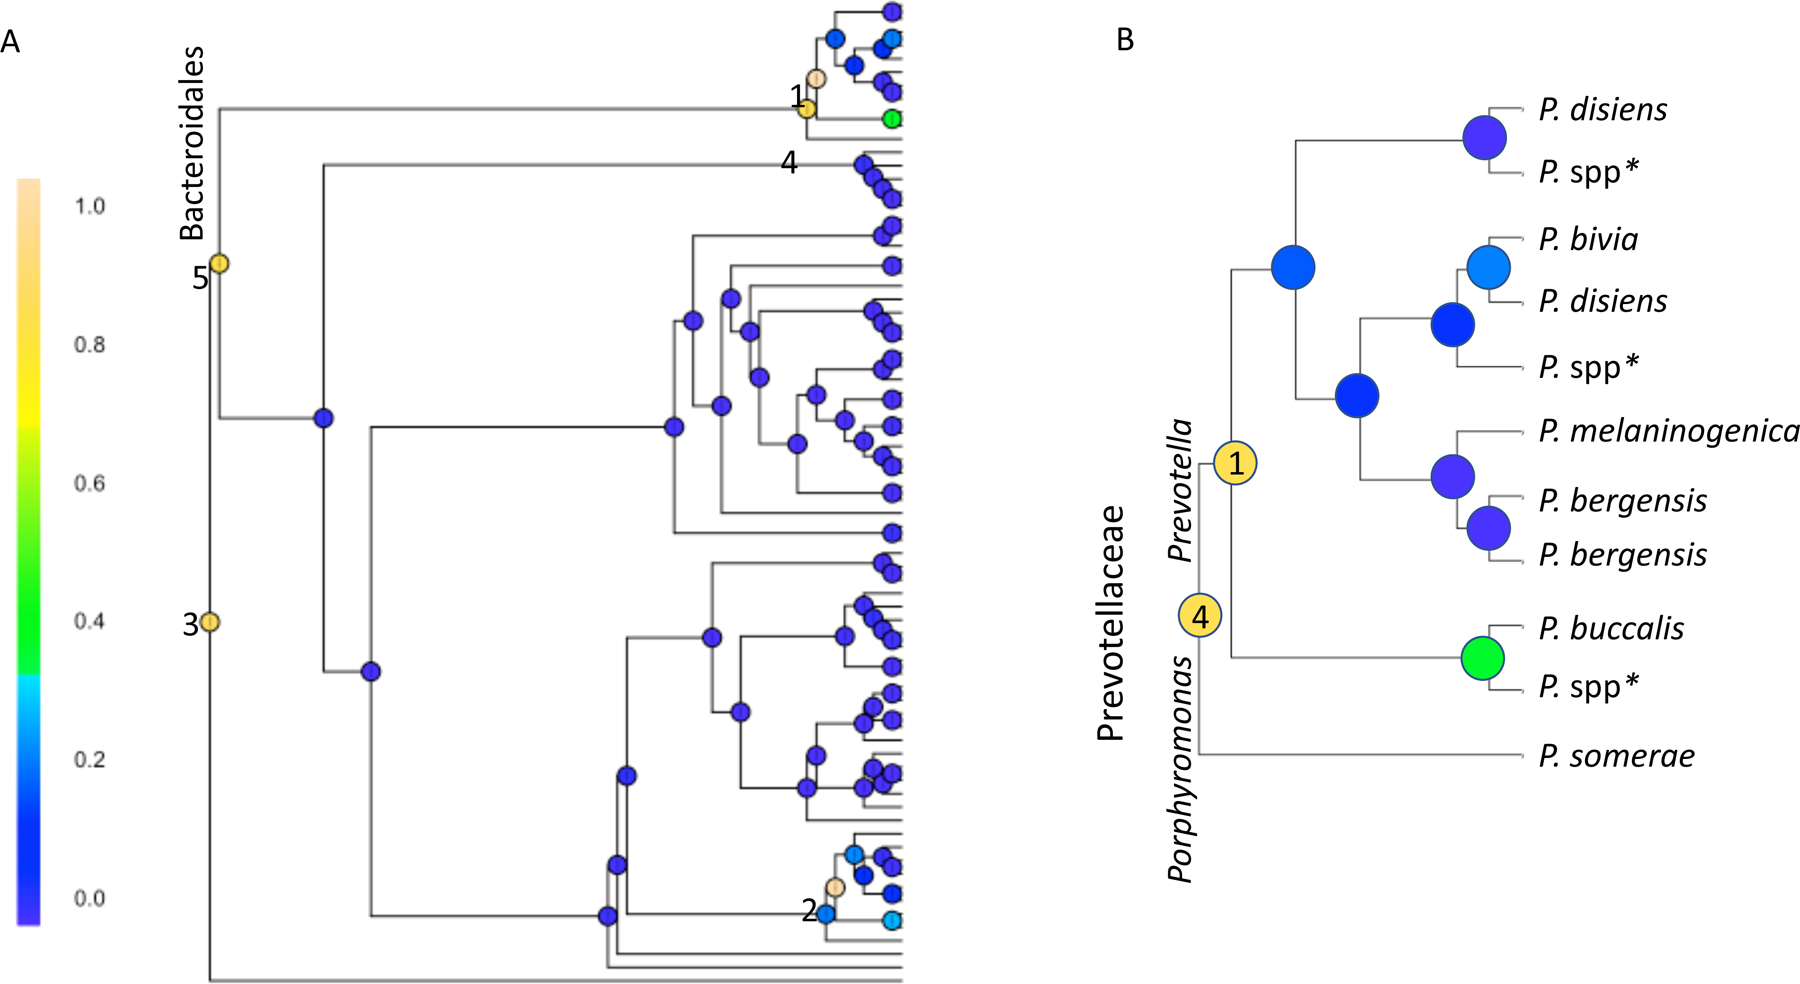
Figure 4: Recurrent UTI with daily antibiotics compared to controls.

Bayesian GCR analysis comparing microbiota in women with recurrent UTIs taking daily antibiotics and age-matched controls (both using vaginal estrogen) while incorporating multiple clinical and technical covariates. The posterior marginal alternative probability (PMAP) was calculated at each node and shaded based on result. The highest probability of a difference between groups is at node #1 (PMAP = 99.96%), which denotes differences in Prevotella species recovered among those with rUTI+abx compared to controls. This node is a downstream branch in the taxonomic tree from two other nodes that also appear to have a high probability of differences between groups. These are identified as #4 (PMAP = 82.5%), which denotes differences in Prevotellaceae and #5 (PMAP = 80.5%), denoting differences in the order Bacteroidales. Node #2 (PMAP = 98.27%) denotes differences in Actinobacteria; this section of the tree is further exploded in Supplemental Figure 2. Node #3 (PMAP = 84.81%) denotes differences in Clostridiales, family Ruminococcaceae. Fig 4A shows the entire taxonomic tree and BCGR results; Figure 4B is an exploded section of this tree showing genus and species information.
