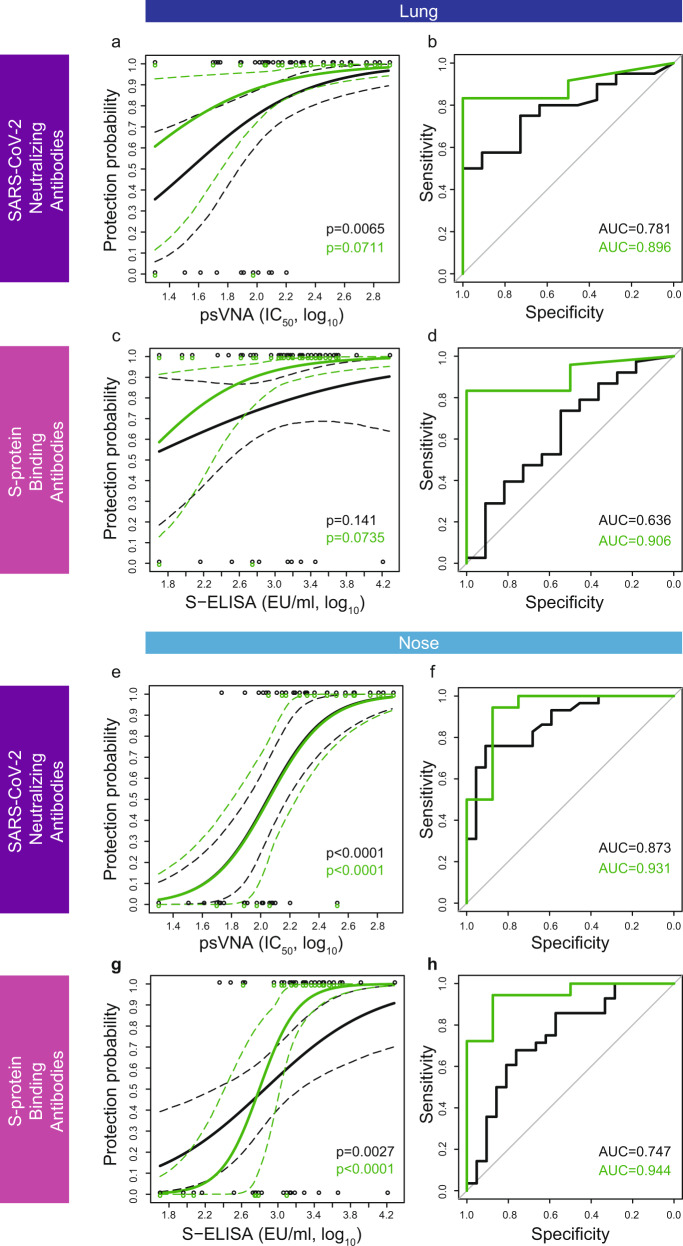
Fig. 1. Logistic models of Ad26.COV2.S and prototype vaccine-induced levels of SARS-CoV-2-binding and -neutralizing antibodies correlate with protection against viral replication in the lung and the nose.
a, e Logistic models of the correlation between the level of SARS-CoV-2-neutralizing antibodies (psVNA at four weeks after vaccination, IC50, log10) and protection against viral load in lung [constructed based on data of 81 NHP obtained in three independent experiments, (a)] and nose (e), based on the dataset of all Ad26-based vaccine candidates combined (black line) and Ad26.COV2.S alone (green line). In all, 95% confidence intervals are represented by dashed lines in the same color. Individual datapoints (y = 0: detectable viral load; y = 1 undetectable viral load) are represented by open circles in the same color. b ROC curves of the data presented in panel a. f ROC curves of the data presented in panel e. Area under the ROC curve (AUC) represents a measure of logistic model sensitivity and specificity. c, g Logistic models of the correlation between the level of S-protein-binding antibodies (S ELISA at four weeks after vaccination, EU/ml, log10) and protection against viral load in lung (c) and nose (g), based on the dataset of all vaccine candidates combined (black line) and Ad26.COV2.S alone (green line). In all, 95% confidence intervals are represented by dashed lines in the same color. Individual datapoints (y = 0: detectable viral load; y = 1 undetectable viral load) are represented by open circles in the same color. d ROC curves of the data presented in panel c. AUC under the ROC is indicated. h ROC curves of the data presented in panel g. AUC under the ROC is indicated. Exact p-value of the SARS-CoV-2-neutralizing antibody analysis for all Ad26-based vaccine candidates combined (black line) is 1.23 × 10−06 (e); exact p-value of the SARS-CoV-2-neutralizing antibody analysis for Ad26.COV2.S alone (green line) is 9.56 × 10−05 (e); exact p-value of the spike protein-binding antibody analysis for Ad26.COV2.S alone (green line) is 7.11 × 10−05 (g). The reported p-values correspond to two-sided testing of the slopes of the logistic-regression models, based on the Likelihood ratio test (chi-square test). P-values have not been corrected for multiple testing. psVNA: pseudotyped virus-neutralization assay; IC50: 50% neutralization antibody titer; S-ELISA: spike protein enzyme-linked immunosorbent assay; EU/mL: ELISA units per milliliter.

