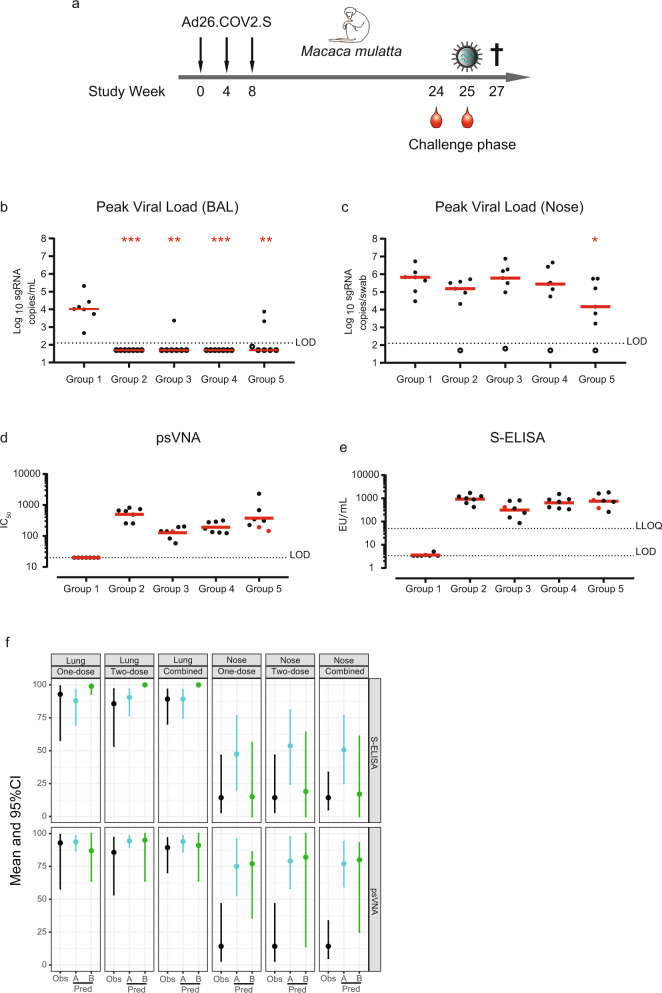
Fig. 3. Durable protection against SARS-CoV-2 in the lower airways after vaccination with Ad26.COV2.S is predicted by binding and neutralizing antibody levels.
a Schematic representation of the 6-month durability study. Data represent results from a single study and were obtained as technical duplicates. About 25 weeks after immunization, animals were challenged with 1 × 10⁵ TCID50 SARS-CoV-2 (intranasal and intratracheal routes). Peak viral loads in bronchoalveolar lavage (BAL) (b) and nose (c) were assessed by reverse-transcription PCR (RT–PCR) specific for subgenomic mRNA (sgRNA, copies/mL, log10). Assay limit of detection (LOD) is indicated by a dashed line. Red line represents group median. d SARS-CoV-2-neutralizing antibodies (psVNA,) were determined at 24 weeks post vaccination (nine days prior to challenge). The three red dots indicate the animals that had detectable viral load (>LOD) in the lung (BAL), as indicated in panel b (one animal in Group 3 and two animals in Group 5). Assay LOD is shown as a dashed line. Red line represents group geometric mean titers (GMT). e S-protein-binding antibody levels (S-ELISA) were determined at 25 weeks post-vaccination (one day prior to challenge). The three red dots indicate the animals that had detectable viral load (>LOD) in the lung. Assay LOD and lower limit of quantification (LLOQ) are shown as dashed lines. Red line represents group GMT. f Comparison of the observed (Obs, one-dose n = 14, two-dose n = 14, combined n = 28) protection proportion with the predicted protection probability at six months after vaccination with Ad26.COV2.S. These analyses were based on prechallenge binding (S-ELISA) and neutralizing antibody (psVNA) levels and correlates of protection models (logistic models [Pred. method A] and sigmoid Emax models [Pred. method B]) constructed on immunogenicity data obtained four weeks after Ad26.COV2.S immunization, in a total of 81 NHP from three independent studies. The statistical analysis was performed using a 2-sided Mann–Whitney U test, without correction for multiple testing. Asterisks indicate significant difference (*p < 0.05, **p < 0.01, ***p < 0.001). Exact p-values for panel b are: 0.00058 (Group 2), 0.00116 (Group 3), 0.000583 (Group 4), and 0.00350 (Group 5). Exact p-values for panel c are: 0.0728 (Group 2), 1 (Group 3), 0.535 (Group 4), and 0.0379 (Group 5). CI: confidence intervals, pred.: predicted, EU: ELISA units, psVNA: pseudotyped virus-neutralization assay, S-ELISA: spike protein enzyme-linked immunosorbent assay.

