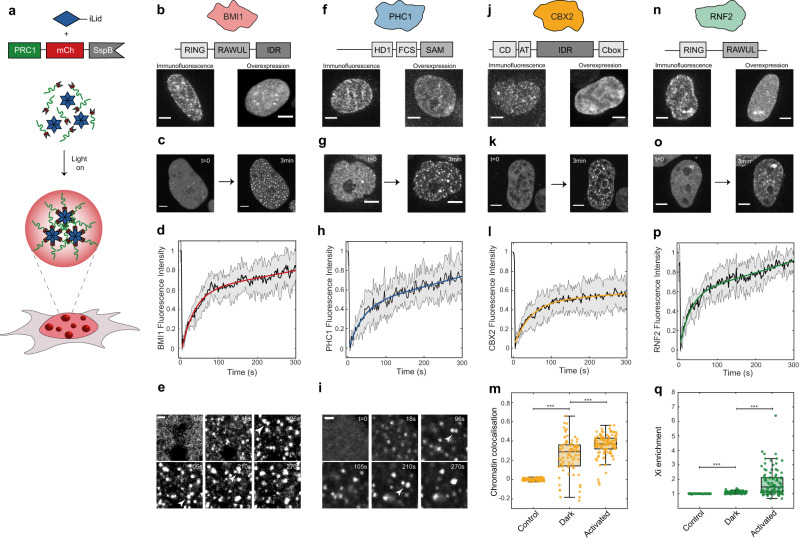
Fig. 1. PRC1 subunit oligomerization drives phase separation.
a The Corelet system enables light-driven oligomerization to probe protein phase behaviour. b BMI1 visualization with immunofluorescence and overexpression. Scale bar is 5 µm. c BMI1-mCh-sspB in HEK293 cells with NLS-Ferritin-Corelet before (t = 0) and after blue light activation (3 min). Scale bar is 5 µm. d FRAP recovery curve of BMI1-mCh-sspB Corelets. Data are presented as mean +/− SD, n = 5 cells. e BMI1 condensates fuse with one another. Arrows indicate condensates about to fuse. Scale bar is 1 µm. f PHC1 visualization with immunofluorescence and overexpression. Scale bar is 5 µm. g PHC1-mCh-sspB in HEK293 cells with NLS-Ferritin-Corelet before (t = 0) and after blue light activation (3 min). Scale bar is 5 µm. h FRAP recovery curve of PHC1-mCh-sspB Corelets. Data are presented as mean +/− SD, n = 8 cells. i PHC1 condensates fuse with one another. Arrows indicate condensates about to fuse. Scale bar is 1 µm. j CBX2 visualization with immunofluorescence and overexpression. Scale bar is 5 µm. k CBX2-mCh-sspB in HEK293 cells with NLS-Ferritin-Corelet before (t = 0) and after blue light activation (3 min). Scale bar is 5 µm. l FRAP recovery curve of CBX2-mCh-sspB Corelets. Data are presented as mean +/− SD, n = 10 cells. m Pearson correlation coefficient between chromatin (stained with Hoechst, example images in Fig. 4) and mCh-sspB (control, n = 93 cells), CBX2-mCh-sspB (in the dark state, n = 83 cells), and CBX2-mCh-sspB (after activation, n = 108 cells). CBX2-mCh-sspB preferentially localizes with chromatin. This colocalization is increased after activation. Statistical significance, indicated by asterisks, was tested with a two-tailed t test, P = 3.0190e−24 for control-Dark and P = 1.0876e−06 for Dark-Activated. Central mark of boxplot represents median, bottom and top edges of the box indicate the 25th and 75th percentiles, respectively, and whiskers extend to the most extreme data points not considered outliers. n RNF2 visualization with immunofluorescence and overexpression. Scale bar is 5 µm. o RNF2-mCh-sspB in HEK293 cells with NLS-Ferritin-Corelet before (t = 0) and after blue light activation (3 min). Scale bar is 5 µm. p FRAP recovery curve of RNF2-mCh-sspB Corelets. Data are presented as mean +/− SD, n = 8 cells. q Partition coefficient of mCh-sspB (control, n = 109 cells), RNF2-mCh-sspB (in the dark state, n = 92 cells), and RNF2-mCh-sspB (after activation, n = 109 cells) on the inactive X-chromosome. Statistical significance, indicated by asterisks, was tested with a two-tailed t test, P = 2.2874e−25 for control-Dark, P = 5.5943e−10 for Dark-Activated. Central mark of boxplot represents median, bottom and top edges of the box indicate the 25th and 75th percentiles, respectively, and whiskers extend to the most extreme data points not considered outliers.

