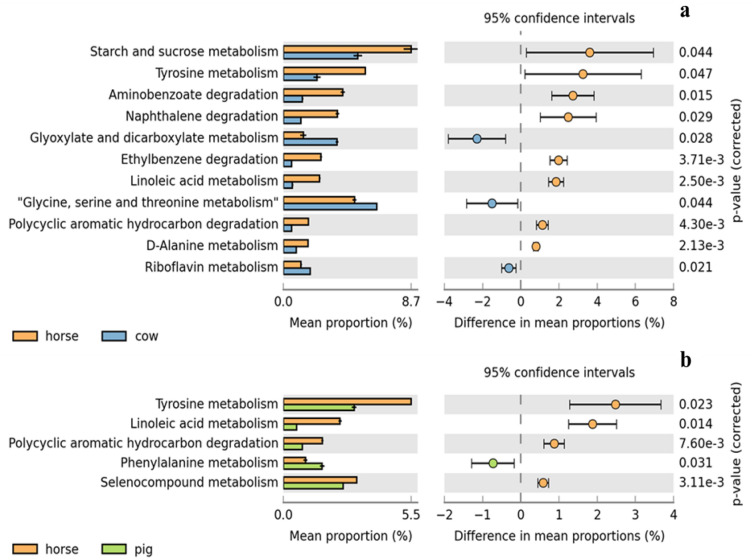
Figure 4.
Extended error bar plot for two-group analysis module comparison of PICRUSt predicted KEGG function data based on horse-cow (a) and horse-pig (b) using Welch’s t-test for two groups. An extended error bar plot was used for the comparison between 2 manure samples and only predicted functions with p < 0.05 are shown. Bar plots on the left side display the mean proportion of each KEGG pathway while the dot plots on the right show the differences in mean proportions between 2 manure samples using p-values.

