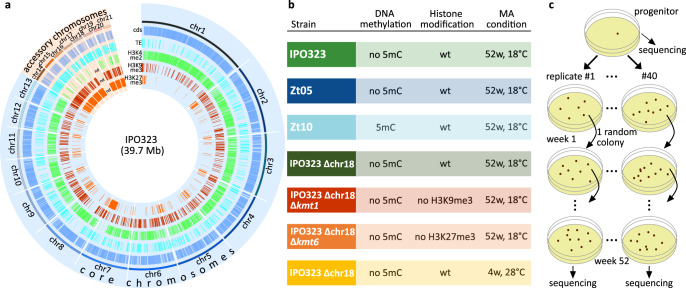
Fig. 1. Overview of the genomic features and the experimental procedures to determine the effect of DNA methylation, histone modifications, and temperature stress on mutation rates.
a Circosplot of the genomic, genetic, and epigenetic features of the reference isolate IPO323 and their distribution among the 13 core and 8 accessory chromosomes (blue: coding sequences (cds), aquamarine: transposable elements (TEs), green: H3K4me2, red: H3K9me3, and orange: H3K27me3 (data from ref. 39). b Experimental conditions for the seven genotype × environment combinations, each comprising 40 independently evolved replicates (MA: mutation accumulation, color code used throughout the study; wt: wild type; w: week). c Experimental procedure for one genotype × environment as an example. Each week, a random one-cell bottleneck was introduced. See Supplementary Methods for a detailed description of the experimental procedures.

