
Fig. 3. Accessory chromosomes, the presence of histone modifications, and TEs are associated with a higher base substitution mutation rate in the wild type.
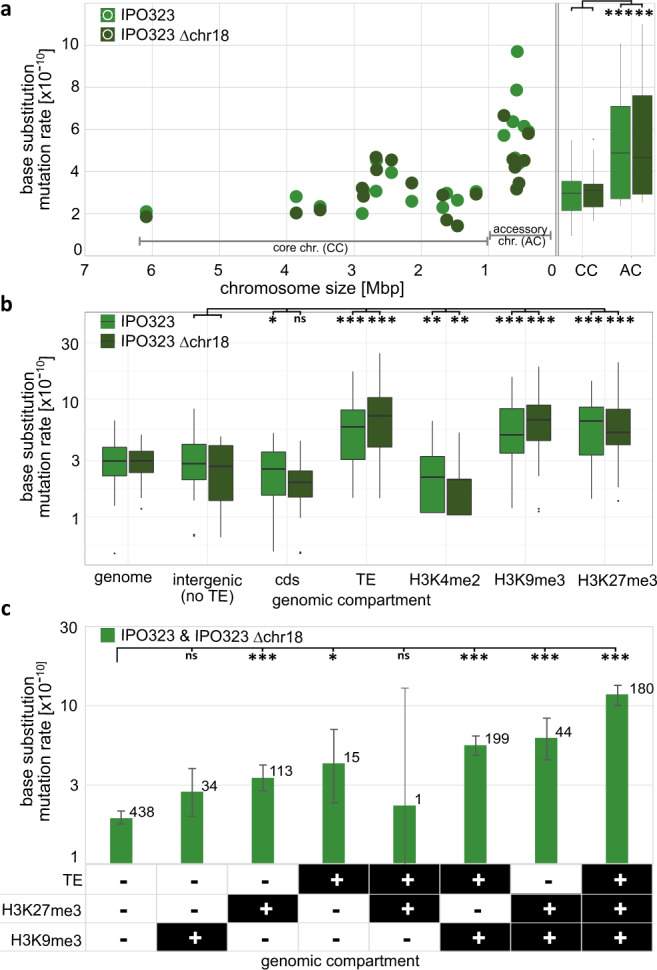
a Correlation between the mean mutation rate for each of the chromosomes for both IPO323 (light green) and IPO323 ∆chr18 (dark green) after 52 weeks at 18 °C, also including a boxplot comparing the base substitution mutation rates within all replicated MA lines between core chromosomes (CCs) and accessory chromosomes (ACs) (n = 40 independently evolved MA lines for each strain). b Boxplot comparing the base substitution mutation rates within each replicated MA line of IPO323 and IPO323 ∆chr18 (n = 40 independently evolved MA lines for each strain). c Comparison of the base substitution mutation rates in a full-factorial approach for the three genomic features TE, H3K9me3, and H3K27me3. Data were pooled for all replicated MA lines of IPO323 and IPO323 ∆chr18 (n = 80 independently evolved MA lines) and is presented as mean values. Total number of observed base substitutions in each genomic compartment is depicted above each bar. Error bars represent 95% Poisson confidence intervals. Categorized FDR-corrected p-values of a, b two-sided paired Wilcoxon tests or c two-sided χ2-tests are shown (*p < 0.05, **p < 0.005, ***p < 0.0005). In order to increase clarity here, only the results of pairwise comparisons that are discussed in the text are depicted. The exact p-values for all pairwise comparisons are provided in Supplementary Data 1. a, b Box plots depict center line, median; box limits, upper and lower quartiles; whiskers, 1.5× interquartile range; points, outliers.