
Figure 1.
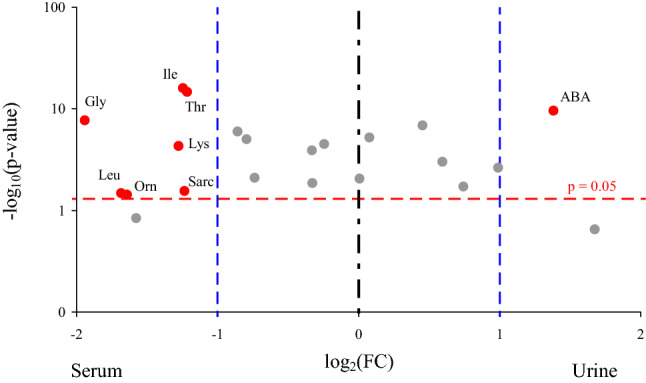
Volcano plot indicating the amino acids with the most meaningful changes analyzed in the serum and urine of the control group based on univariate analysis—y-axis: Mann–Whitney p value, x-axis: fold change (FC). Each dot represents one amino acid. The amino acids with significance p < 0.05 are located above the red horizontal line. The amino acids with more than a twofold change of a concentration are located on right and left from the respective blue right and left vertical lines. Only red dots indicate amino acids with the clinical and statistical differences. ABA, α-aminoisobutyric acid; Gly, glycine; Ile, isoleucine; Leu, leucine; Lys, lysine; Orn, ornithine; Sarc, sarcosine; Thr, threonine; p, significant value.