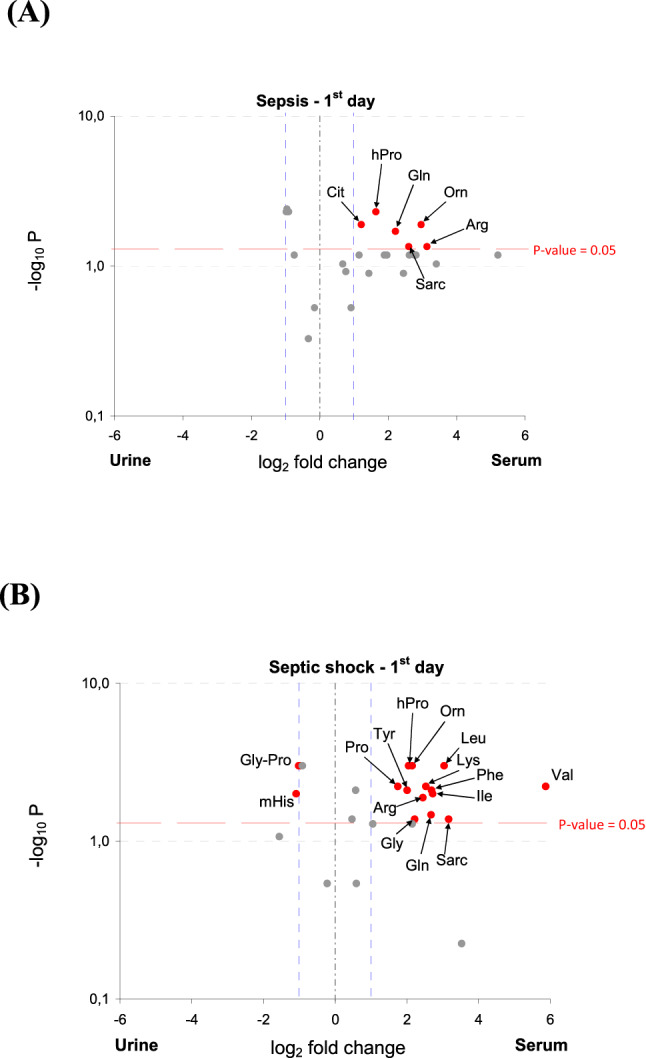
Figure 3.

Volcano plot indicating amino acids with the most meaningful changes analyzed in the urine and serum of sepsis (A) and septic shock (B) on admission based on univariate analysis—y-axis: Mann–Whitney p value, x-axis: fold change (FC). Each dot represents one amino acid. The amino acids with significance p < 0.05 are located above the red horizontal line. The amino acids with more than a twofold change of a concentration are located on right and left from the respective blue right and left vertical lines. Only red dots indicate amino acids with the clinical and statistical differences. Arg, arginine; Cit, citrulline; Gln, glutamine; Gly, glycine; Gly-Pro, glycine-proline; hPro, 4 hydroxyproline; Ile, isoleucine; Leu, leucine; Lys, lysine; mHis, 3-methyl-histidine; Orn, ornithine; Phe, phenylalanine; Pro, proline; Sarc, sarcosine; Tyr, tyrosine; Val, valine; p, significant value.
