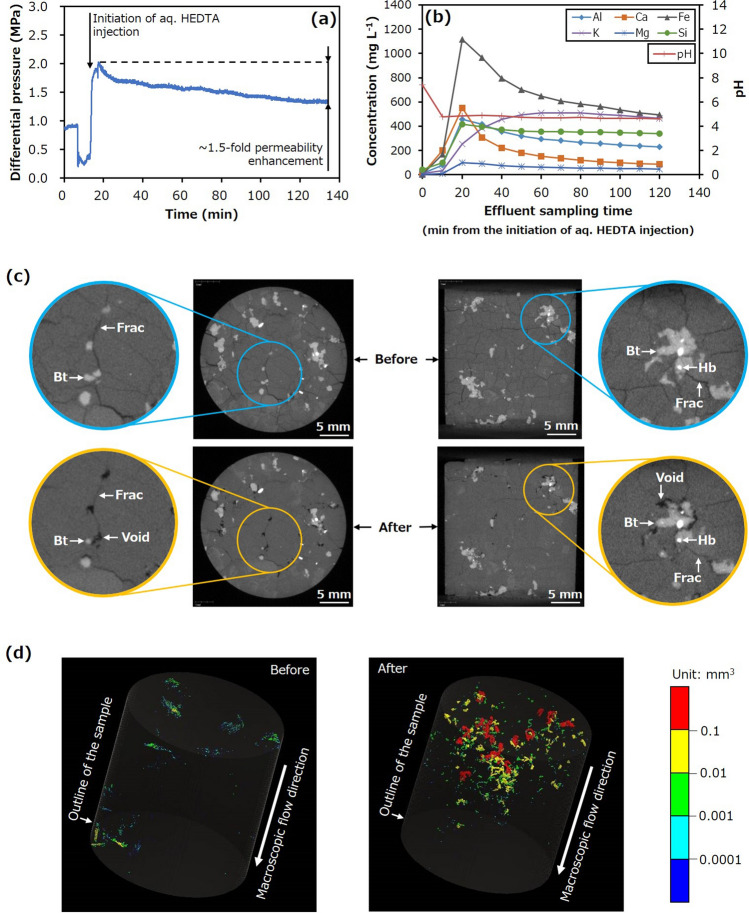
Figure 3.
Hydraulic and chemical behaviours, and X-ray CT images for Run 1. (a) Differential pressure between the inlet and outlet as a function of time and (b) concentrations of various elements in the effluent and effluent pH as functions of time during Run 1. X-ray CT images displaying (c) the sample before and after the trial and (d) distributions of significantly large pores and fracture apertures before and after the trial (Bt Biotite, Hb Hornblende, Frac Fracture).

