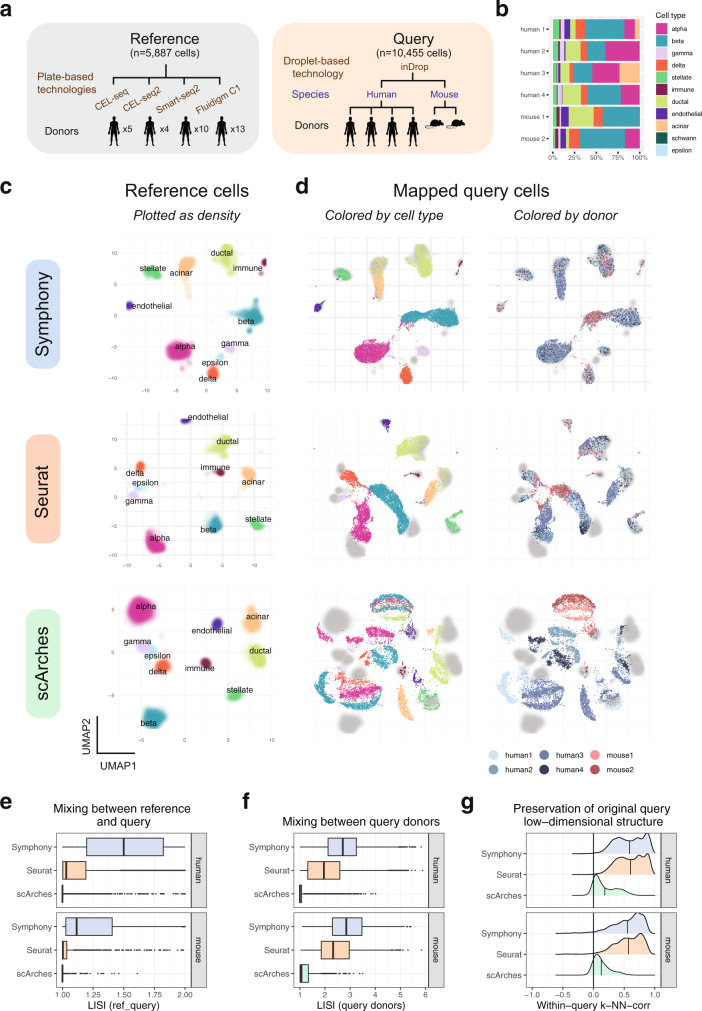
Fig. 4. Symphony maps multi-donor, multi-species study to human pancreatic islet cell reference.
a Schematic of mapping experiment with reference ( = 5887 cells, 32 donors) built from four human pancreas datasets and query dataset ( = 10,455 cells, from four human donors and two mouse donors) sequenced on a new technology (inDrop). b Bar plot shows relative proportions of cell types per query donor. We integrated the reference datasets de novo using Harmony, Seurat anchor-based integration, or trVAE, then mapped the query onto the corresponding reference using Symphony, Seurat, or scArches, respectively. UMAP plots of the resulting joint embeddings showing c density of integrated reference cells colored by cell type and d individual query cells colored by cell type (as defined by Baron et al.46) (left) or donor identity (right) with reference densities plotted in the back in gray. Degree of integration for each method was measured by LISI metric between reference and query labels (ref_query) (e) and LISI between query donors (f) for each query cell neighborhood, faceted by species (human: = 8569 cells from four donors, mouse: = 1866 cells from two donors). Boxplot center line represents the median; lower and upper box limits represent the 25% and 75% quantiles, respectively; whiskers extend to box limit ±1.5 × IQR; outlying points plotted individually. g Degree to which the query low-dimensional structure is preserved after mapping, as measured by within-query k-NN correlation (wiq-kNN-corr, with = 500) calculated across all query cells, within each query donor. Vertical lines indicate the mean wiq-kNN-corr.

