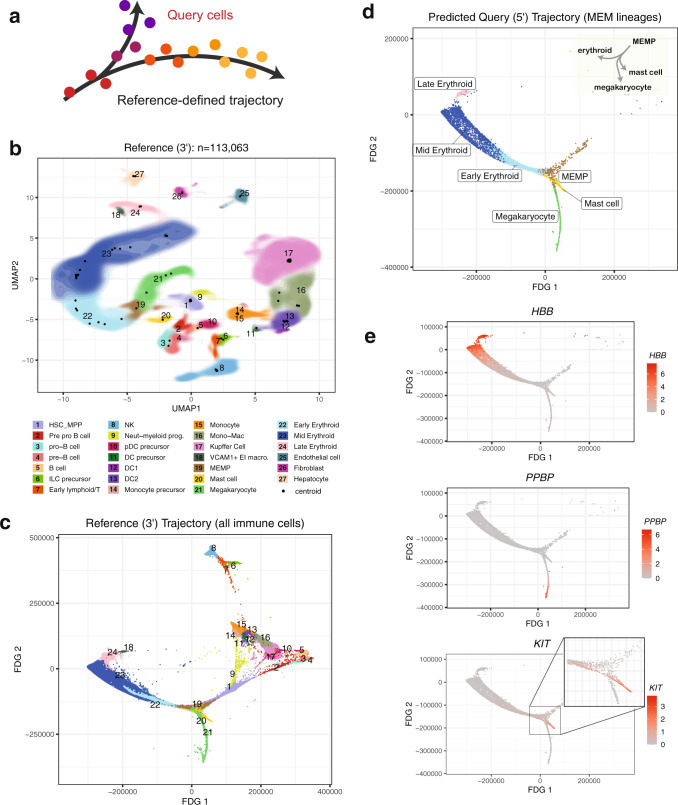
Fig. 5. Localizing query cells along a trajectory of fetal liver hematopoiesis.
a Schematic showing precise placement of query cells along a continuous reference-defined trajectory. In this example (b–e), the reference ( = 113,063 cells, 14 donors) was sequenced using 10 x 3’ chemistry, and the query ( = 25,367 cells, 5 donors) was sequenced with 10x 5’ chemistry. b Symphony reference colored by cell types as defined by Popescu et al.47. Contour fill represents density of cells. Black points represent soft-cluster centroids in the Symphony mixture model. c Reference developmental trajectory of immune cells (FDG coordinates obtained from original authors). Query cells in the MEM lineages ( = 5141 cells) were mapped against the reference and query coordinates along the trajectory were predicted with 10-NN (d). The inferred query trajectory preserves branching within the MEM lineages, placing terminally differentiated states on the ends. e Expression of lineage marker genes (PPBP for megakaryocytes, HBB for erythroid cells, and KIT for mast cells). Cells colored by log-normalized expression of gene.

