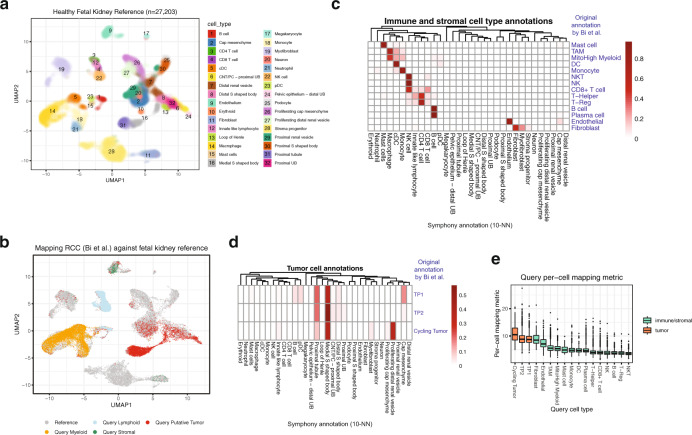
Fig. 6. Mapping tumor cells onto an atlas of healthy tissue.
We built a reference of healthy fetal kidney48 and mapped a renal cell carcinoma dataset49. a UMAP of healthy fetal kidney reference ( = 27,203 cells), colored by cell type as defined by the original publication. b Mapping tumor query dataset (which contains myeloid, lymphoid, stromal, and tumor compartments) onto the reference. Cells colored by reference (gray) or query compartment (as defined by original authors). c, d Heatmaps comparing original query cell types (rows), as defined by Bi et al., to the predicted reference cell types from Symphony (columns) for c immune and stromal compartments and d tumor cells. Color bar indicates the proportion of query cells per original cell type that were predicted to be of each reference type (rows sum to 1). Columns sorted by hierarchical clustering on the average gene expression (all genes) for the cell types to order similar types together. e Boxplot of per-cell mapping metric per query cell type (higher values indicate less confidence in the mapping), colored by tumor cells (orange) or immune/stromal (green) as defined in Bi et al. Boxplot shows query cells from 8 donors across 17 cell types: Cycling tumor ( = 117 cells), Tumor program 2 (TP2, = 4599), Tumor program 1 (TP1, = 3324), Fibroblast ( = 91), Endothelial ( = 271), Tumor-associated macrophage (TAM, = 5053), Mitochondrial-High myeloid ( = 1407), Mast cell ( = 39), Monocyte ( = 1157), Dendritic cell (DC, = 419), Plasma cell ( = 463), T-Helper ( = 3284), CD8 + T cell ( = 9056), Natural killer (NK, = 2245), B cell ( = 962), T-Regulatory cell (T-Reg, = 750), and Natural killer T cell (NKT, = 811). Boxplot center line represents the median for the cell type; lower and upper box limits represent the 25% and 75% quantiles, respectively; whiskers extend to box limit ±1.5 × IQR; outlying points plotted individually.

