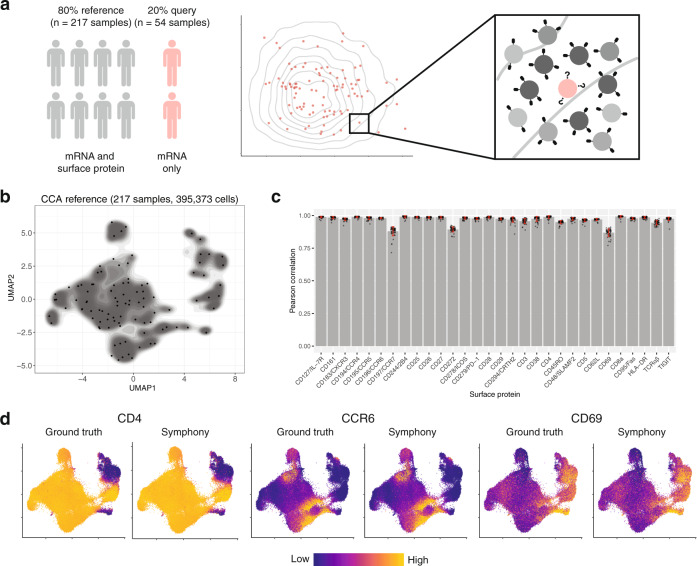
Fig. 7. Mapping onto a multimodal reference to infer query surface protein expression in memory T cells.
a Schematic of multimodal mapping experiment. The dataset was divided into training and test sets (80% and 20% of samples, respectively). The training set was used to build a Symphony reference, and the test set was mapped onto the reference to predict surface protein expression in query cells (pink) based on 50-NN reference cells (gray). b Symphony reference built from mRNA/protein CCA embedding. Contour fill represents density of reference cells ( = 395,373 cells from 217 samples). Black points represent soft-cluster centroids in the Symphony mixture model. c We measured the accuracy of protein expression prediction with the Pearson correlation between predicted and ground truth expression for each surface protein across query cells in each donor (total = 104,716 cells from 54 samples). Bar height represents the mean per-donor correlation for each protein, error bars represent standard deviation, and individual data points show correlation values per donor. d Ground truth and predicted expression of CD4, CCR6, and CD69 based on CCA reference. Ground truth is the 50-NN-smoothed expression measured in the CITE-seq experiment. Colors are scaled independently for each marker from minimum (blue) to maximum (yellow) expression.

