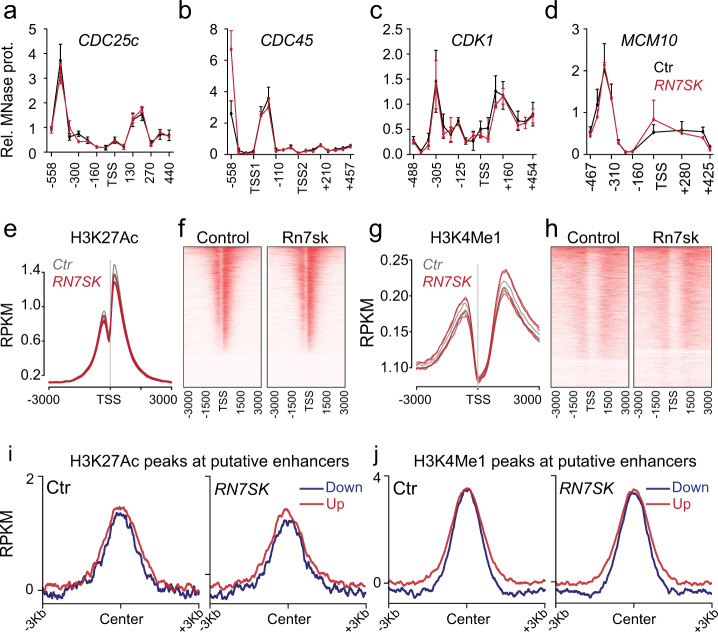
Fig. 5. Chromatin at enhancers and promoters is unaltered in RN7SK knock-down cells.
a–d Micrococcal Nuclease (MNase) protection assay around the transcriptional start sites (TSS) of four downregulated candidate genes showing nucleosome distribution in control (Ctr) (black lines) and RN7SK knock-down (red lines) cells 24 h after siRNA transfection (n = 4 transfections). Data are presented as mean values ± SD. e–h Occurrence of H3K27Ac (e) and H3K4Me1 (g) ±3000 bases from the TSS in Ctr (grey) or RN7SK knock-down (red) cells (n = 4 ChIP-seq experiments). Representative heatmaps (f, g) showing sequencing reads from data in (e, g). i, j Distribution of H3K27Ac (i) or H3K4Me1 (j) ChIP seq signal ±3000 bases from the enhancer centre in up- (red) or downregulated (blue) genes in 4SU RNAseq dataset (padj < 0.05, Log2Fc > 0.3 or < −0.3) in Ctr (left hand panels) or RN7SK knock-down (right hand panels) cells. Shown is one representative ChIP-seq experiment out of four replicates. Source data are provided as a Source Data file.

