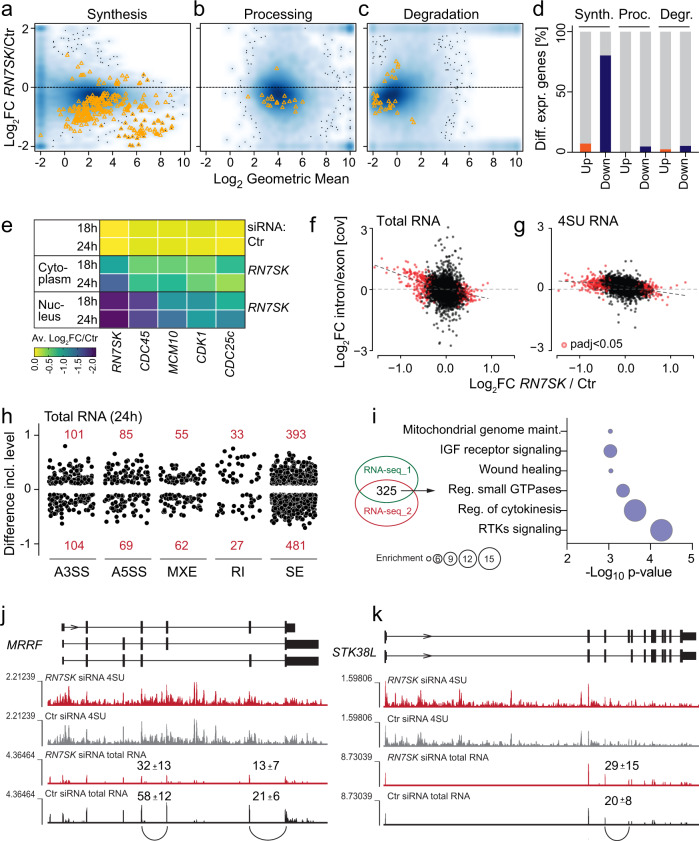
Fig. 6. Loss of RN7SK primarily affects RNA synthesis.
a–c Density scatter plots (darker colours for higher density) of changes in the absence of RN7SK versus time points (0 and 24 h and 10 min RNA labelling time). Shown are changes in RNA levels caused by differences in RNA synthesis (a), processing (b), and mature mRNA degradation (c). Each yellow triangle is one gene. d Percent of differentially expressed genes shown in (a–c). e Average (Av.) log2 fold-change (FC) of RNA levels of the indicated genes in the cytoplasm or nucleus after 18 and 24 hours (h) knock-down of RN7SK measured by RT-qPCR. (n = 4 transfections). f, g Correlation of log2 (Fc) expression and log2 (intron/exon coverage) in total (f) or 4SU (g) RNA seq datasets 24 h after RN7SK siRNA transfection. h Splicing differences in total RNA 24 h after RN7SK-depletion (splicing FDR > 0.05; inclusion difference >0.1 or < −0.1). A3SS: alternative 3’ splice site; A5SS: alternative 5’ splice site; MXE: mutual exclusive exon; RI: intron retention; SE: exon skipping. i Gene Ontology analysis using differentially spliced transcripts overlapping in two independent total RNA-seq datasets. j, k Examples of alternatively spliced transcripts resulting in down- (j) or up- (k) regulation of the RNA shown as UCSC genome. Source data are provided as a Source Data file.

