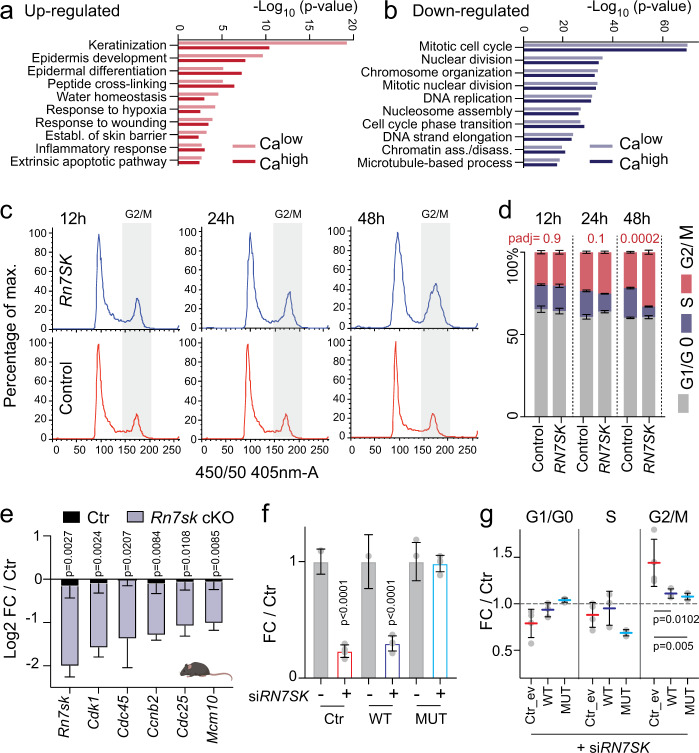
Fig. 7. Cell cycle exit causes differentiation in RN7SK-depleted epidermal cells.
a, b Gene ontology analysis of up- (red; a) or downregulated (blue; b) genes (padj < 0.001; log2FC > or < 0.75) in response to RN7SK knock-down in human keratinocytes grown in calcium low (Calow; light bars) or high (Cahigh; dark bars) conditions. c, d Cell cycle profiles of primary human keratinocytes (c) and quantification of percent of cells in the different phases of cell cycle (d) after 12, 24, or 48 h in control or RN7SK siRNA treated cells (n = 5 transfections). Data are presented as mean values ±SD. e RT-qPCR for five cell cycle regulators in mouse epidermis of control (black) or RN7SK cKO (blue; mouse line 1) animals treated for 2 weeks with 4-OHT. f RN7SK levels after repression (siRN7SK) in control empty vector (Ctr; red border) transfected cells or cells over-expressing wild-type (WT; dark blue border) or mutated (MUT; light blue border) RN7SK constructs in an epidermal cancer line (FaDu) (n = 4 transfections). g Quantification of RN7SK-depleted cells in G1/G0-, G2/M- and S-phase of the cell cycle in the presence of an empty vector as control (Ctr_ev; red) or the wild-type (WT; dark blue) or mutated (MUT; light blue) RN7SK construct. (n = 4 transfections). Shown is mean ±SD (d–g). Two-way ANOVA (multiple comparisons) (d, f, g). Multiple two-tailed unpaired t-tests (e). Exact p-values are indicated. Source data are provided as a Source Data file.

