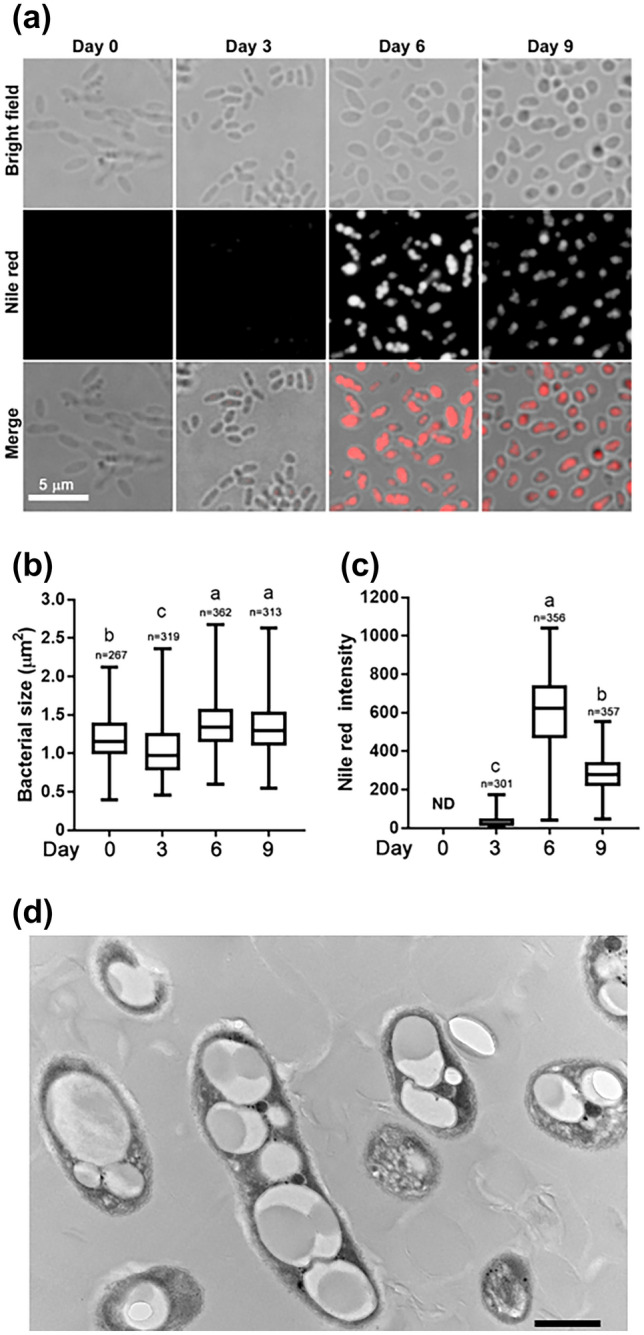
Figure 2.

Microscopy of I. sakaiensis grown on poly(ethylene terephthalate) (PET). (a) Bright field and fluorescence microscopy of Nile red-stained I. sakaiensis cells after growth on PET for 0 (pre-cultured cells in 802 nutrient-rich medium for 1 day), 3, 6, and 9 days. Box-and-whisker plots show the distribution of cell areas (b) and average fluorescence intensity of Nile red in cells (c); median values, 25th to 75th percentiles, and range are shown. n, number of cells or fluorescent dot assemblies. ND, not detected. Different letters above the plots indicate significant differences among groups (Tukey's multiple comparisons test, P < 0.0001). (d) Transmission electron microscopy image of cells grown on PET granules for 6 days. Scale bar, 600 nm.
