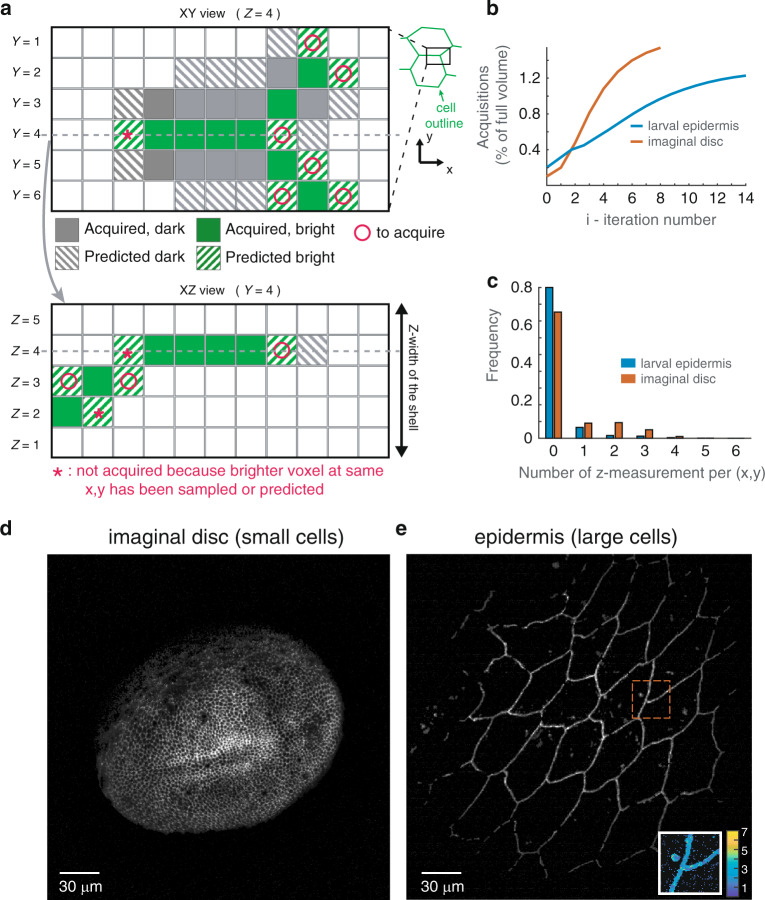
Fig. 3. Propagative scan within the estimated shell.
a voxel-level schematic of the algorithm. Using the information from previously acquired voxels (which may be bright or dark voxels), a prediction (hatched coloring) based on the nearest neighbors is made for neighboring pixels in each layers of the shell, and at a distance β = 1 in this example. Two corresponding XY and XZ sections are shown. The signal will be acquired only in the voxels that are predicted to be bright (o). Moreover, on the XZ section, voxels that are predicted to be bright, but for which a brighter voxel has already been acquired or predicted are not sampled (*). b Number of acquisitions as a function of iteration number. c Number of acquisitions performed along z (including the initial pre-scan) for each x, y using the propagative imaging (β = 1 pixel): no acquisitions have been performed for more than 75% of the x, y coordinates in the case of the small imaginal disc cells and 90% for the large epidermis cells. d, e Maximum intensity projection of the shell at the end of the propagative imaging for the imaginal disc (d) and the epidermis (e). An inset in (e) maps the number of acquisitions performed along z for a small region of interest (outlined in red in the main image). Junctions and endocytic vesicles are fully sampled, while the rest is only sparsely sampled

