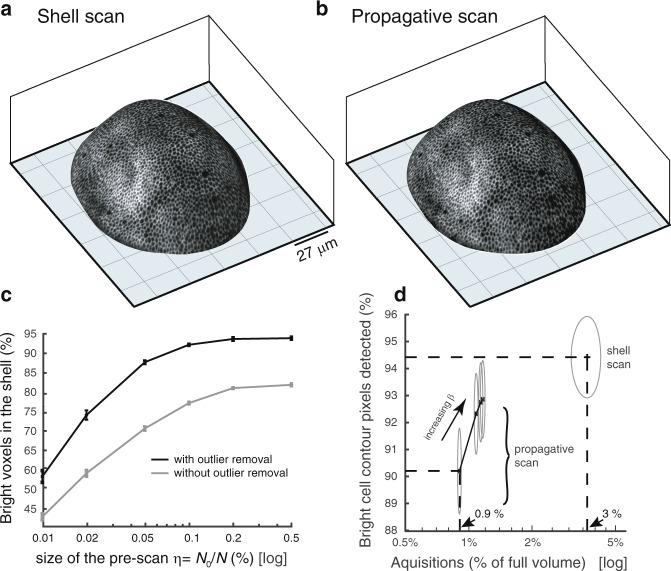
Fig. 4. Accuracy of shell estimation and ability of bright contour acquisition.
a, b 3D visualizations of emulated shell-scan and propagative-scan (β = 5) using raw data from a full scan acquisition. c Goodness of the shell estimated as a function of the size of the pre-scan. The goodness is measured from the percentage of epithelial bright voxels (i.e. bright voxels that are in the ground truth shell) that fall in the estimated shell (the objective being to maximize this quantity). The result is shown with and without outlier removal in the surface estimation step. d Goodness of cell contour delineation with the shell-scan and propagative-scan, as a function of the number of acquisitions required. For the propagative-scan, results with different NN maximal prediction distances β are shown (β = 1; 3; 5; 10). All points plotted on these curves correspond to the average of the result over 50 different random pre-scans (with error bars in (c) and the height and width of ellipses in (d) set to their standard-deviation)

