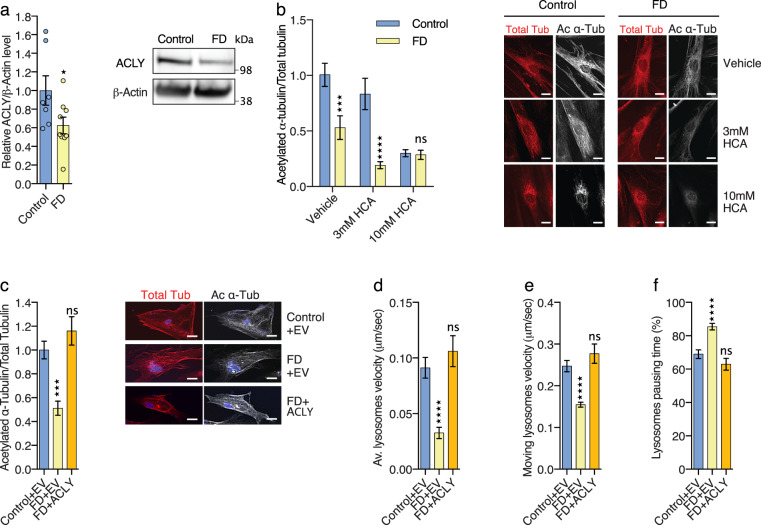
Fig. 4. ACLY expression rescues defects of α-tubulin acetylation and microtubule-dependent transport in human FD fibroblasts.
a Immunoblotting of ACLY and ß-ACTIN in cultured human primary fibroblast extracts from Control and FD patients. b Immunolabeling and quantification of acetylated α-tubulin and total tubulin levels in primary fibroblasts from healthy controls and FD patients incubated with the ACLY inhibitor hydroxy-citrate acid (HCA). Scale bar is 50 µm. c Immunolabeling and quantification of acetylated α-tubulin and total α-tubulin levels in extracts from primary fibroblasts from healthy controls and FD patients transfected with control or ACLY expressing plasmids. Scale bar is 50 µm. d–f Time-lapse recording of MT-dependent transport of lysosome (LysoTracker®) in fibroblasts from Control or FD patients, transfected with Control or ACLY plasmids, to analyze average (av.) velocity (d), moving velocity (e) and percentage of pausing time (f). Description of graphical summaries here within are histograms of means ± SEM. Significance was determined by: (a) two-sided t test, (b) two-sided two-way analysis of variance (ANOVA), (c) two-sided ANOVA, and (d, e, f) two-sided Kruskal–Wallis one-way ANOVA. Specifically, [(a) p = 0.0467, t = 2.181, df = 14; (b) p = 0.0038, Finteraction (2, 109) = 5.876; (c) p < 0.0001, F = 13.17; (d) p < 0.0001, K = 48.95; (e) p < 0.0001, K = 35.10; (f) p < 0.0001, K = 40.98. In addition, the post hoc multiple comparisons to analyze statistical difference of each condition compared to control for (b) is Sidak’s test, for (c) is Dunnet’s test, for (d, e, f) are Dunn’s test, and are *p < 0.05, ***p < 0.001, and ****p < 0.0001. a 5 human primary fibroblast lines per group. b Number of cells: Control n = 26 (Vehicle), n = 18 (3 mM HCA), n = 20 (10 mM HCA); FD n = 18 (Vehicle), n = 15 (3 mM HCA), n = 18 (10 mM HCA). Number of fibroblast lines per group: Control n = 5; FD n = 4. c Number of cells: Control + EV n = 15; FD + EV n = 15; FD + Acly n = 15. d Number of vesicles: Control + EV n = 262; FD + EV n = 217; FD + Acly n = 143. 5 human primary fibroblast lines per group. e Number of vesicles: Control + EV n = 133; FD + EV n = 68; FD + Acly n = 89. 5 human primary fibroblast lines per group. f Number of vesicles: Control + EV n = 251; FD + EV n = 217; FD + Acly n = 143. 5 human primary fibroblast lines per group. Source data are provided with this paper.

