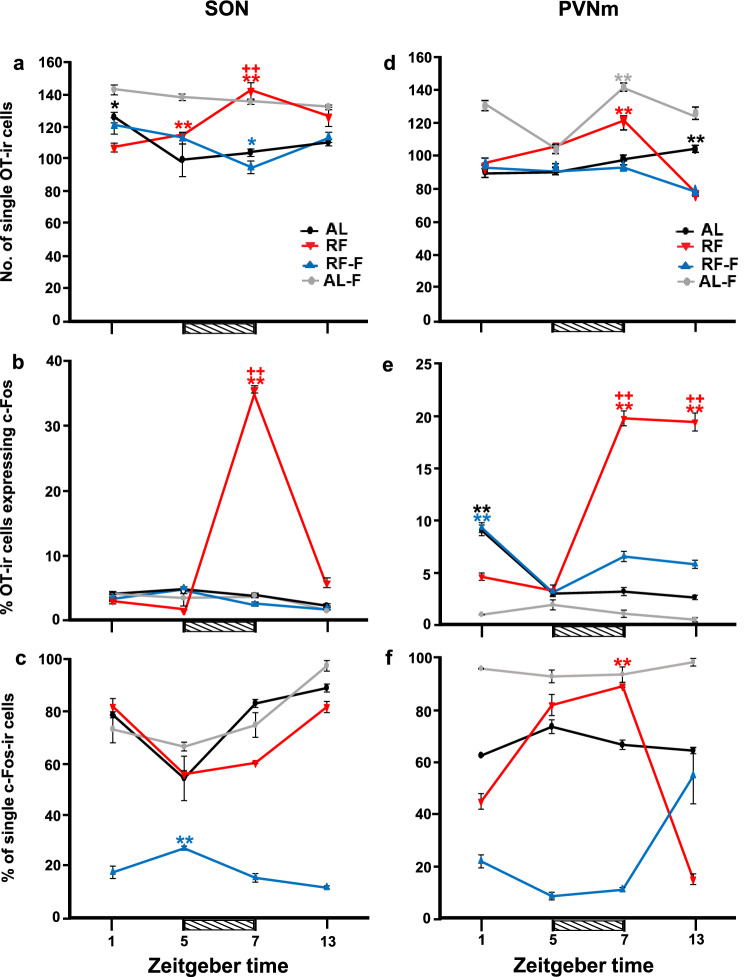
Figure 3.
Activation of Supraoptic and Paraventricular hypothalamic nucleus by food intake. Number (mean ± SEM) of single OT (a, d), percentage of OT expressing c-Fos (b, e) and percentage of single c-Fos (c, f) cells in the SON (a–c) and PVNm (d–f) in rats kept ad libitum (AL), under restricted food access (RF), under RF followed by 2 days of fasting (RF-F) and ad libitum fed followed by 2 days of fasting (AL-F) at four different zeitgeber times (n = 5 per time point). Horizontal stripped bar represents mealtime (from ZT5 to ZT7) for the RF group and expected mealtime for the RF-F group. **Indicate difference between the highest and lowest value within the same group (P < 0.05); ++indicate difference between groups at the same time point (P < 0.05).

