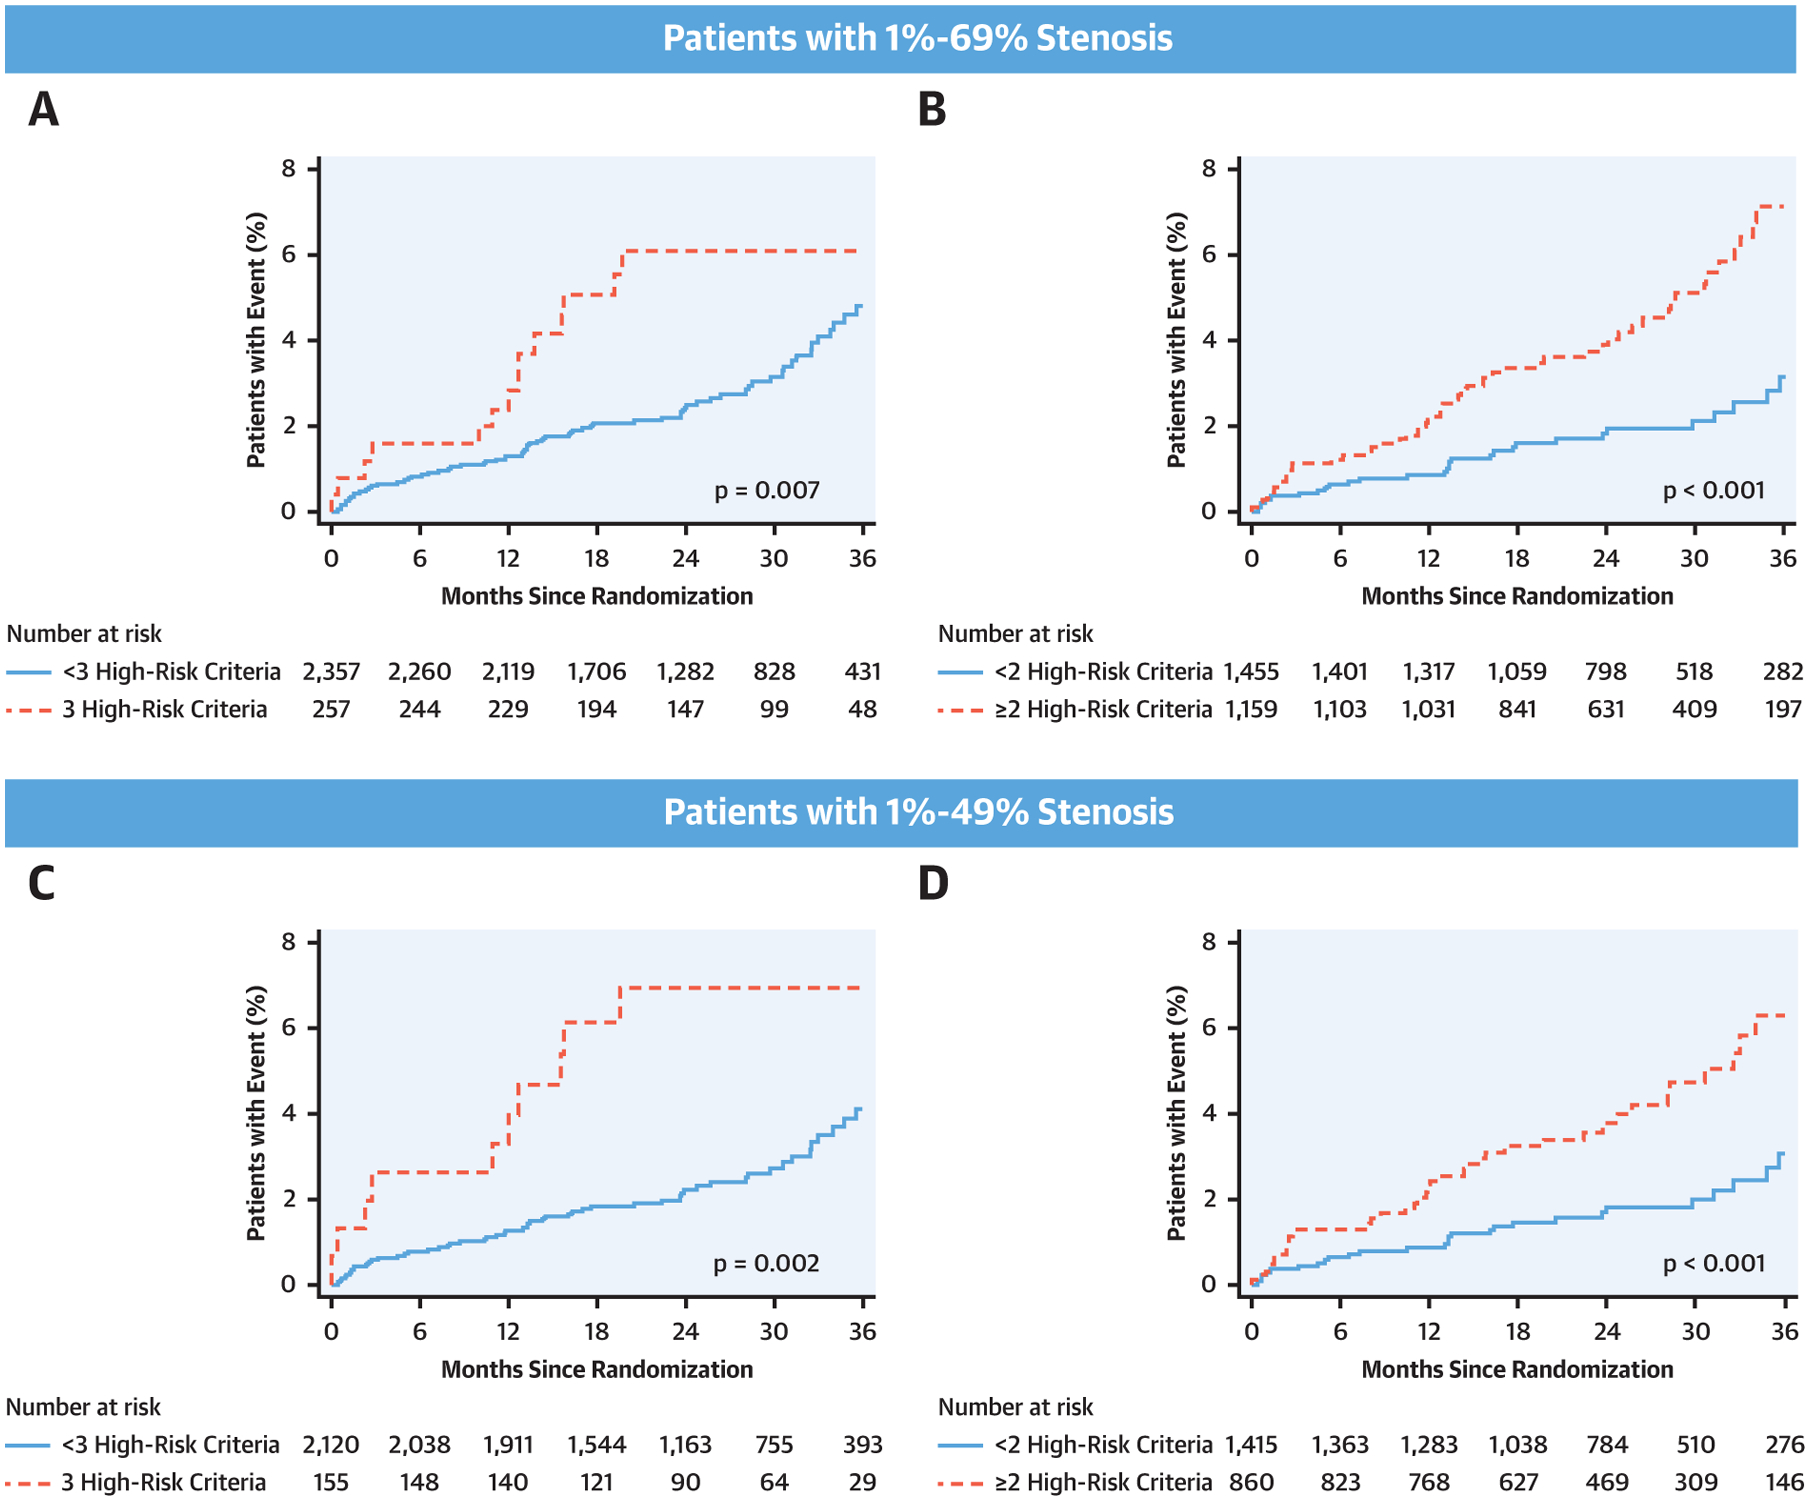
CENTRAL ILLUSTRATION. Kaplan-Meier Curves of Higher- Versus Lower-Risk Patients With Nonobstructive CAD.

Kaplan-Meier curves of higher (ASCVD ≥7.5%, any HRP features, and mild/moderate stenosis) versus lower risk in patients with 1% to 69% stenosis (A and B) and those with 1% to 49% stenosis (C and D). Patients that met 3 criteria versus those that did not are displayed in A and C, respectively. Patients that met 2 of these higher risk criteria versus those that did not are shown in B and D, respectively. Event rates were significantly higher in patients classified as higher-risk nonobstructive CAD: p = 0.007 and p = 0.002 for A and C and p < 0.001 for (B) and (D). ASCVD = atherosclerotic cardiovascular disease; other abbreviations as in Figures 1 and 2.
