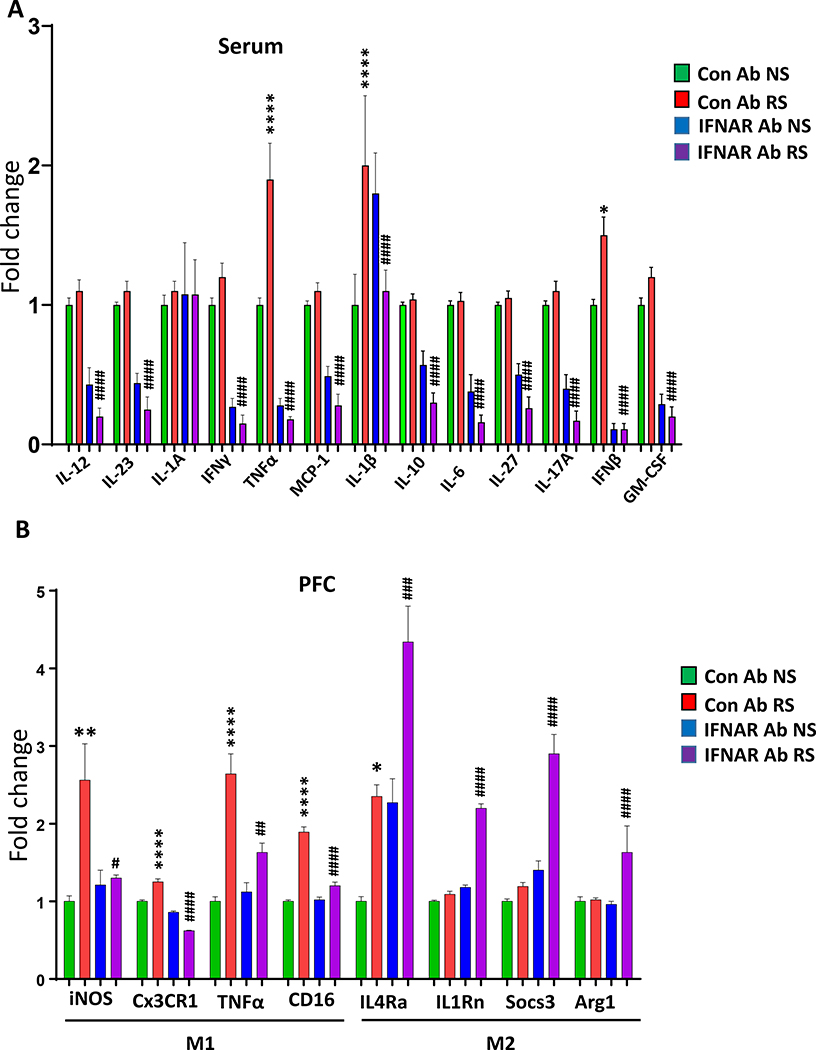
Figure 3. IFNAR antibody treatment attenuates chronic stress-induced changes in serum inflammatory markers, and in M1 and M2 markers in the PFC.
(A) Array of 13 cytokines in the serum samples from no stress (NS) and restraint stress (RS) mice treated with control (Con) Ab or IFNAR Ab. IL-12. Two-way ANOVA, treatment (F (1, 19) = 81.67 p<0.001); ####p<0.0001 vs Con Ab RS; n =5–7 per group. IL-23. Two-way ANOVA, treatment (F (1, 20) = 91.68p<0.0001); ####p<0.05 vs Con Ab RS; n=5–7 per group. IL-1A. Two-way ANOVA, NSp>0.05 vs Con Ab RS; n=5–7 per group. IFNγ. Two-way ANOVA, treatment (F (1, 20) = 155.2 p<0.001); ####p<0.0001 vs Con Ab RS; n=5–7 per group. TNFα. Two-way ANOVA, stress (F (1, 20) = 9.92, p<0.01); treatment (F (1, 20) = 95.54 p<0.001); stress X treatment interaction (F (1, 20) = 14.62, p<0.01); ****p<0.0001 vs Con Ab NS; ####p<0.0001 vs Con Ab RS; n=5–7 per group. MCP1. Two-way ANOVA, treatment (F (1, 20) = 98.27, p<0.001); ####p<0.0001 vs Con Ab RS; n=5–7 per group. IL1β. Two-way ANOVA, stress X treatment interaction (F (1, 20) = 6.88, p<0.05); ****p<0.0001 vs Con Ab NS, ####p<0.0001 vs Con Ab RS; n=5–7 per group. IL-10. Two-way ANOVA, treatment (F (1, 20) = 79.09, p<0.0001);###p<0.001 vs Con Ab RS; n=5–7 per group. IL-6. Two-way ANOVA, treatment (F (1, 20) = 102.0, p<0.0001); ####p<0.0001 vs Con Ab RS; n=5–7 per group. IL-27. Two-way ANOVA, treatment (F (1, 20) = 85.32, p<0.0001); ####p<0.0001 vs Con Ab RS; n=5–7 per group. IL-17A. Two-way ANOVA, treatment (F (1, 20) = 108.3, p<0.001); ####p<0.0001 vs Con Ab RS; n=5–7 per group. IFNβ. Two-way ANOVA, stress (F (1, 17) = 5.309, p<0.05); treatment (F (1, 17) = 146.7 p<0.001); stress X treatment interaction (F (1, 17) = 5.309, p<0.05); *p<0.05 vs Con Ab NS, ####p<0.0001 vs Con Ab RS; n=5–7 per group. GM-CSF. Two-way ANOVA, treatment (F (1, 20) = 153.5, p<0.001); ####p<0.0001 vs Con Ab RS; n=5–7 per group. (B) mRNA expressions of M1/M2 phenotype in the PFC of no stress (NS) and restraint stress (RS) mice treated with control (Con) Ab or IFNAR Ab.. mRNA expressions of M1 markers; iNOS. Two-way ANOVA, stress (F (1, 20) = 10.32, p=0.0044); stress x treatment interaction (F (1, 20) = 7.985, p=0.0104); **p<0.01 vs Con Ab NS, #p<0.05 vs Con Ab RS; n=6 per group. Cx3CR1. Two-way ANOVA, treatment (F (1, 20) = 231.9, p<0.0001); stress x treatment interaction (F (1, 20) = 60.84, p<0.0001); ****p<0.0001 vs Con Ab NS, ####p<0.0001 vs Con Ab RS; n=6 per group. TNFα. Two-way ANOVA, Stress (F (1, 20) = 46.33, p<0.0001), treatment (F (1, 20) = 7.940, p=0.0106); stress x treatment interaction (F (1, 20) = 12.80, p=0.0019); ****p<0.0001 vs Con Ab NS, ##p<0.01 vs Con Ab RS; n=6 per group. CD16. Two-way ANOVA, Stress (F (1, 20) = 129.7, p<0.0001), treatment (F (1, 20) = 50.84, p<0.0001); stress x treatment interaction (F (1, 20) = 57.09, p<0.0001); ****p<0.0001 vs Con Ab NS, ####p<0.0001 vs Con Ab RS; n=6 per group. IL4Rα. Two-way ANOVA, Stress (F (1, 20) = 41.45, p<0.0001), treatment (F (1, 20) = 37.66, p<0.0001); *p<0.05 vs Con Ab NS, ###p<0.001 vs Con Ab RS; n=6 per group. IL1Rn. Two-way ANOVA, Stress (F (1, 20) = 277.3, p<0.0001), treatment (F (1, 20) = 380.9, p<0.0001); stress x treatment interaction (F (1, 20) = 194.3, p<0.0001); ####p<0.0001 vs Con Ab RS; n=6 per group. Socs3. Two-way ANOVA, Stress (F (1, 20) = 48.16, p<0.0001), treatment (F (1, 20) = 87.03, p<0.0001); stress x treatment interaction (F (1, 20) = 28.23, p<0.0001); ####p<0.0001 vs Con Ab RS; n=6 per group. Arg1. Two-way ANOVA, Stress (F (1, 20) = 70.76, p<0.0001), treatment (F (1, 20) = 48.29, p<0.0001); stress x treatment interaction (F (1, 20) = 62.80, p<0.0001); ####p<0.0001 vs Con Ab RS; n=6 per group.

