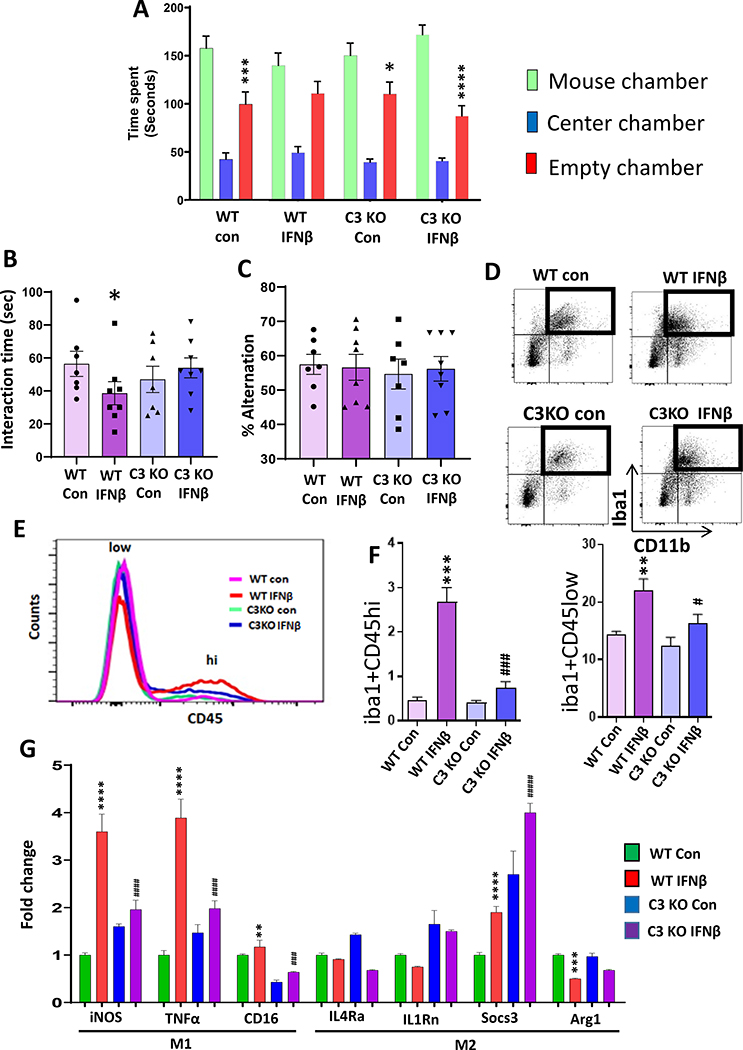
Figure 4. Complement component 3 mediates IFNβ–induced neuroinflammation and deficits in social behavior.
(A-C) C3 deletion attenuated IFNβ-induced deficits in social behavior. WT and C3 KO mice were treated with vehicle (PBS; Con) or IFNβ. A, Time in chamber in the three-chamber social interaction test. Two-way ANOVA, chamber (F (2, 78) = 119.2, p<0.0001); *p<0.05, ***p<0.001, ****p<0.0001 and (mouse chamber vs empty chamber); n=7–8 per group). B, Reciprocal social interaction test. Two-way ANOVA, genotype X treatment interaction (F (1, 24) = 8.221, p=0.0085); *p<0.05 vs WT Con; n=7 per group). C, Y-maze test for spatial working memory. Two-way ANOVA; n=7–8 per group. (D-F) Flow cytometry analysis of infiltrating monocytes and resident microglia in the PFC of WT and C3 KO mice treated with Con or IFNβ. D-E, Flow cytometry gating strategy showing Iba1+ cells were analyzed using CD45 to differentiate infiltrating monocytes (CD45hi) from resident microglia (CD45low). F, % of Iba1+ cells expressing CD45high. Two-way ANOVA, genotype (F (1, 8) = 28.57, p=0.0007), treatment (F (1, 8) = 45.84, p=0.0001), genotype X treatment interaction (F (1, 8) = 24.89, p=0.0011); ***p<0.001 vs WT con, ###p<0.001 vs WT IFNβ; n=3 per group). % of Iba1+ cells expressing CD45low. Two-way ANOVA, genotype (F (1, 8) = 19.59, p=0.0022), treatment (F (1, 8) = 45.37, p=0.0001); **p<0.01 vs WT con, #p<0.05 vs WT IFNβ; n=3 per group). (G) mRNA expressions of M1/M2 phenotype in the PFC of WT and C3 KO mice treated with Con or IFNβ. mRNA expressions of M1 markers; iNOS. Two-way ANOVA, genotype (F (1, 20) = 36.35, p<0.0001); treatment (F (1, 20) = 294.5, p<0.0001), genotype X treatment interaction (F (1, 20) = 168.6, p<0.0001); ****p<0.0001 vs WT Con, ####p<0.0001 vs WT IFNβ; n=6 per group. TNFα. Two-way ANOVA, genotype (F (1, 20) = 56.80, p<0.0001); treatment (F (1, 20) = 316.6, p<0.0001), genotype X treatment interaction (F (1, 20) = 155.1, p<0.0001); ****p<0.0001 vs WT Con, ####p<0.0001 vs WT IFNβ; n=6 per group. CD16. Two-way ANOVA, genotype (F (1, 20) = 341.6, p<0.0001); treatment (F (1, 20) = 41.19, p<0.0001); **p<0.0001 vs WT Con, ###p<0.0001 vs WT IFNβ; n=6 per group. mRNA expression of M2 markers; IL4Rα. Two-way ANOVA, treatment (F (1, 20) = 5.027, p=0.0364), n=6 per group. IL1Rn. Two-way ANOVA, genotype (F (1, 20) = 119.8, p<0.0001); treatment (F (1, 20) = 6.709, p=0.0175); n=6 per group. Socs3. Two-way ANOVA, genotype (F (1, 20) = 236.6, p<0.0001); treatment (F (1, 20) = 74.92, p<0.0001), ****p<0.0001 vs WT Con, ####p<0.0001 vs WT IFNβ; n=6 per group. Arg1. Two-way ANOVA, treatment (F (1, 20) = 42.80, p=0.1909), genotype X treatment interaction (F (1, 20) = 4.569, p=0.0451); ***p<0.001 vs WT Con; n=6 per group.

