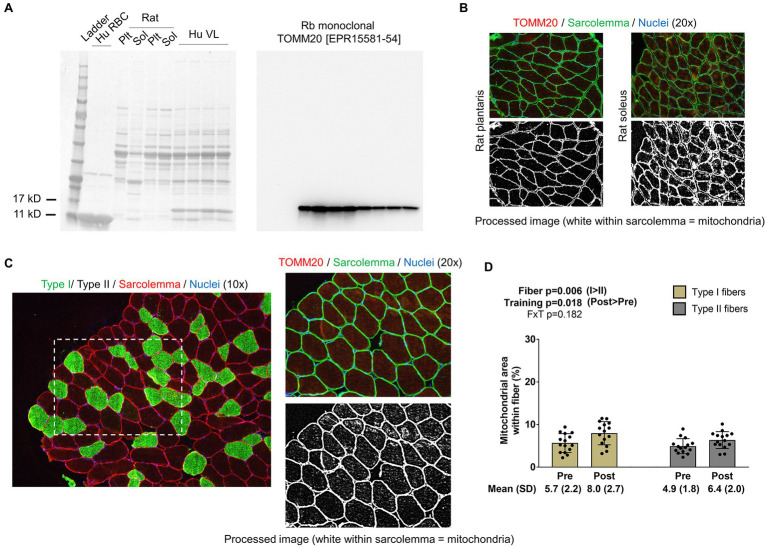
Figure 3.
Type I and II fiber mitochondrial areas with training. Panel A shows Western blotting validation results regarding the veracity of the TOMM20 antibody. The left inset is the Ponceau stain of human red blood cells (Hu RBC), rat plantaris (Plt) and soleus (Sol) lysates, and human vastus lateralis muscle (Hu VL). The right inset contains results from Western blotting. Panel B shows IHC validation results from rat Plt and Sol muscles (20x images). Panel C shows IHC and TOMM20 staining from our human participants; specifically, this figure demonstrates how mitochondrial areas were quantified using 20x images and cross-referenced to fiber type from 10x images of serial sections. Panel D shows how training affected mitochondrial areas in type I and II fibers. Bar graph data are presented as means ± standard deviation values, and individual participant data are overlaid. n=15 participants. Abbreviation: FxT, fiber x training interaction.

