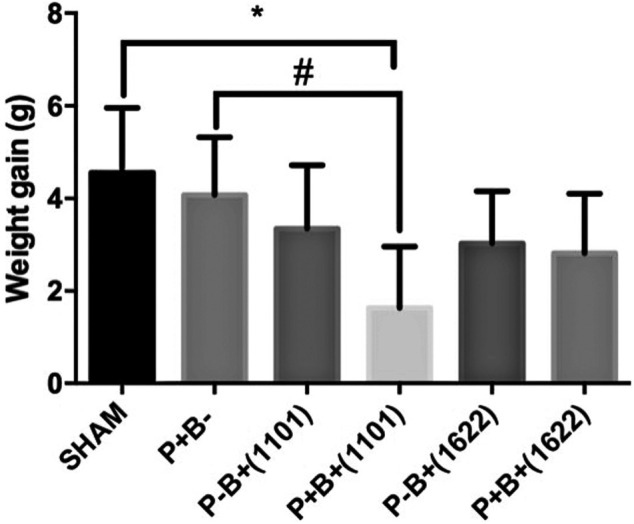
FIGURE 1.

Mean and SD of weight gain in grams after 45 days of experimental period of C57Bl/6 mice submitted to different treatments: SHAM (negative control), P + B- (positive control), P-B+ (1101) (B. breve 1101A), P + B+ (1101) (microbial consortium + B. breve 1101A), P-B+ (1622) (B. bifidum 1622A) and P + B+ (1622) (Microbial consortium + B. bifidum 1622A). *Statistically significant difference in relation to negative control (SHAM), # Statistically significant difference in relation to positive control (P + B-). ANOVA, Tukey’s multiple comparison, p <0.05%. Data representative of two independent experiments (n = 8 mice/per group).
