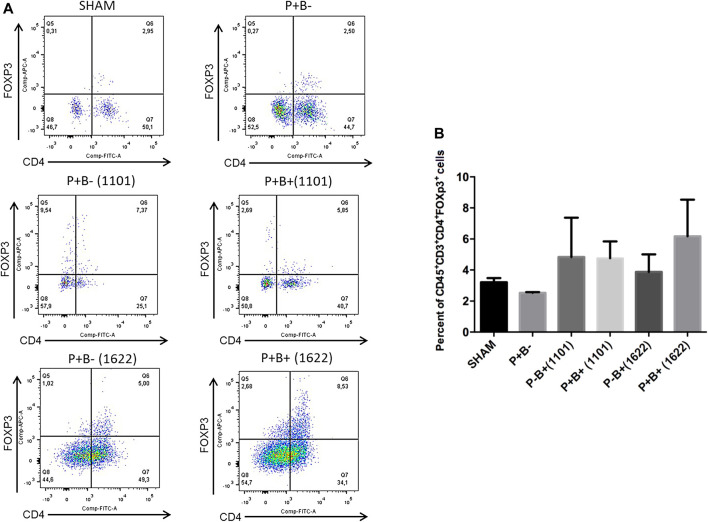
FIGURE 4.
Treg populations remained unchanged in gingival tissues of C57Bl/6 mice submitted to different treatments: SHAM (negative control), P + B- (microbial consortium), P-B+ (1101) (B. breve 1101A), P + B+ (1101) (microbial consortium + B. breve 1101A), P-B+ (1622) (B. bifidum 1622A) and P + B+ (1622) (microbial consortium + B. bifidum 1622A). In (A) representative flow cytometry diagram showing the gating of CD4+, FoxP3+ Treg cells. In (B) Average percentages of CD4+, FoxP3+ Treg cells. No differences among the groups. ANOVA, Tukey’s multiple comparison, p>0.05%. Facs plots represent the results of one of two independent experiments with similar results (n = 2 pooled samples from 4 mice/per group).

