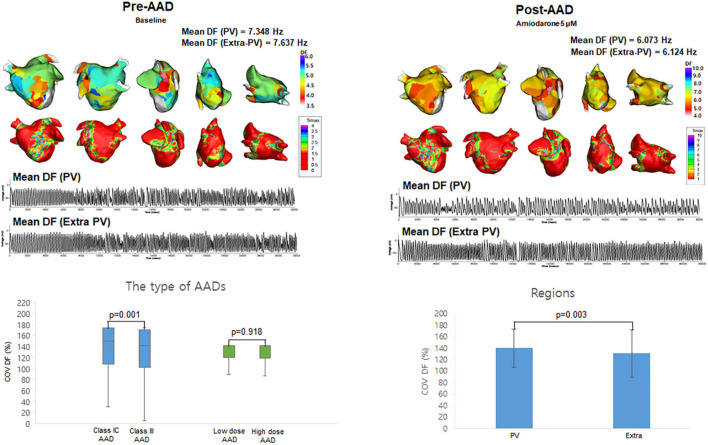
FIGURE 2.
The effects of antiarrhythmic drugs (AADs) on extra-PV and pulmonary vein (PV) regions. The 3D dominant frequency (DF) map indicated that the mean DF was higher in the PV regions. Electrograms demonstrated regional voltage changes in PV and extra-PV areas. Coefficient of Variation-Dominant Frequency (COV-DF) was higher in class IC and PV region.

