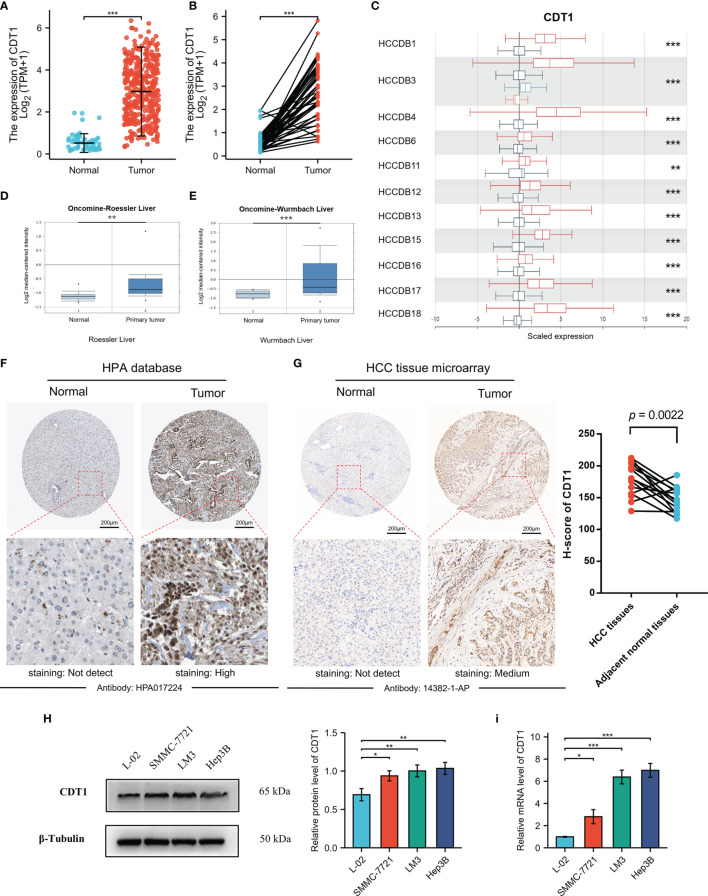
Figure 3.
The relative expression of CDT1 in HCC at the cell and tissue levels. (A) CDT1 expression in normal and tumor tissues (TCGA and GTEx). (B) CDT1 expression in paired tissues (TCGA and GTEx). (C) The mRNA level of CDT1 in different HCC datasets (HCCDB). (D, E) CDT1 mRNA expression in normal and tumor tissues (ONCOMINE). (F) The protein expression level of CDT1 in HCC and normal liver tissues (HPA). (G) The IHC staining results of CDT1 level in HCC and adjacent non-tumor tissue (clinical tissue microarray of HCC) and the corresponding scatter diagram. Statistical significance was determined by paired t-test. (H, I) Western blot and qRT-PCR results of CDT1 expression in normal human liver cell line and HCC cell lines. Data are expressed as means ± SD. *p < 0.05, **p < 0.01, ***p < 0.001.

