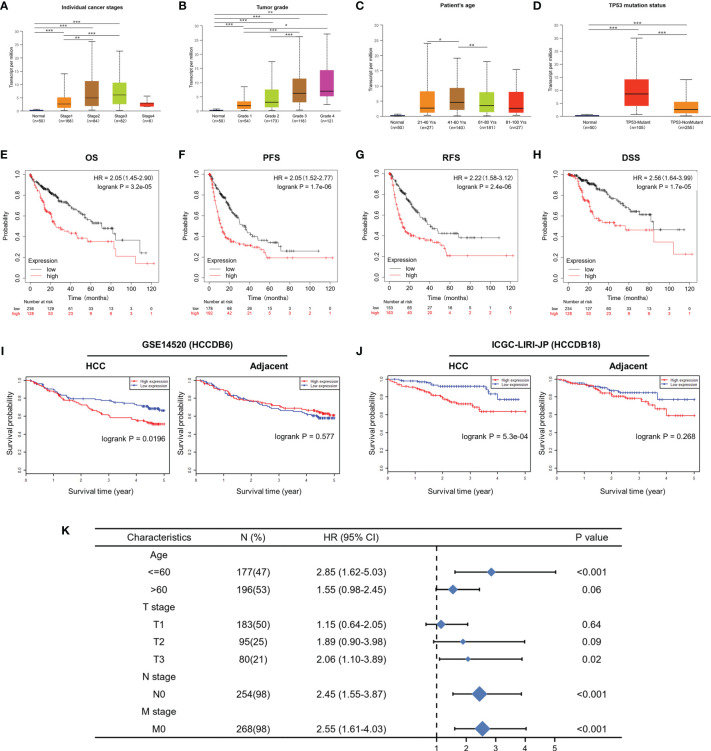
Figure 4.
Correlation between CDT1 expression and the clinical parameters of HCC patients and its prognostic significance. (A–D) Relationship of CDT1 mRNA levels with individual cancer stages, tumor grade, age, and TP53 mutation status of HCC patients. (E–H) Relationship of CDT1 expression with OS, PFS, RFS, and DSS in TCGA database. (I, J) Relationship of CDT1 expression with OS of HCC patients in GEO and ICGC databases. (K) Forest plot showing the impact of CDT1 on OS at different TNM stages and ages. *p < 0.05, **p < 0.01, ***p < 0.001.

