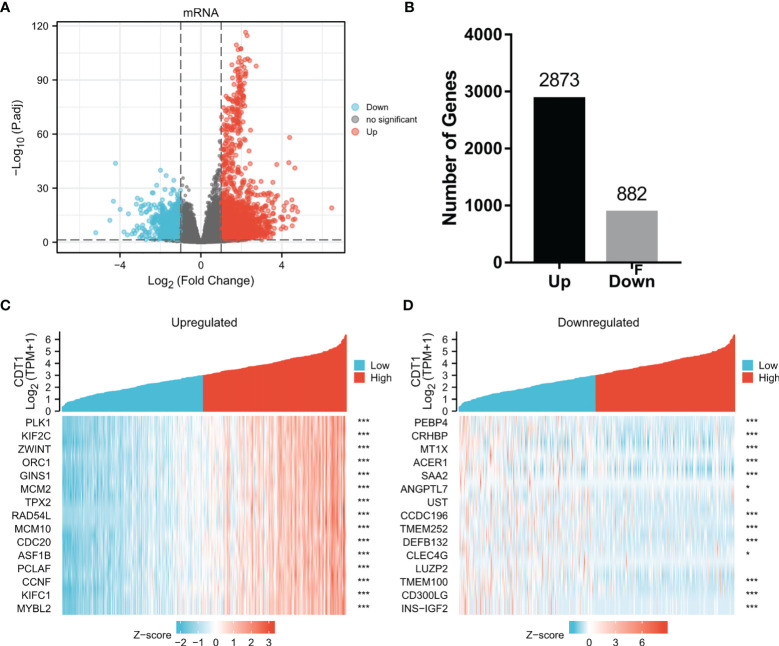
Figure 6.
Volcano plots and heatmap plots of DEGs between the expression of CDT1high and CDT1low in HCC samples. (A) The volcano plot described 3755 DEGs (|log2fold change| > 1 and adjusted p-value < 0.05). (B) The histogram showing the number of up-regulated or down-regulated genes. (C, D) The heatmaps depicted the expression of 15 significant upregulated and downregulated genes in HCC samples with CDT1high and CDT1low expression. *p < 0.05, ***p < 0.001.

