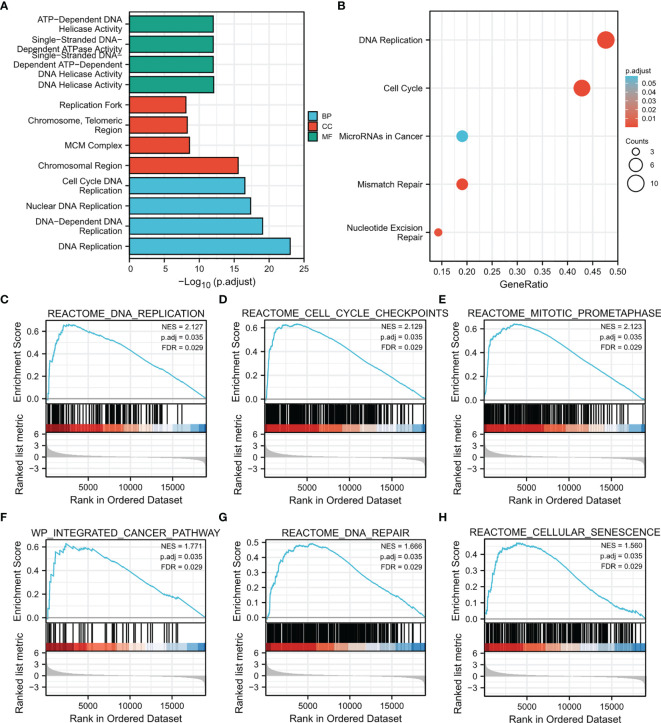
Figure 7.
Results of enrichment analysis. (A, B) GO and KEGG enrichment results of CDT1-related DEGs (15 most significant upregulated and 15 most significant downregulated genes in HCC samples with CDT1high and CDT1low expression). (C–H) Gene set enrichment plots of (C) DNA replication, (D) cell cycle checkpoints, (E) mitotic prometaphase, (F) integrated cancer pathway, (G) DNA repair, and (H) cellular senescence with high CDT1 expression from GSEA.

