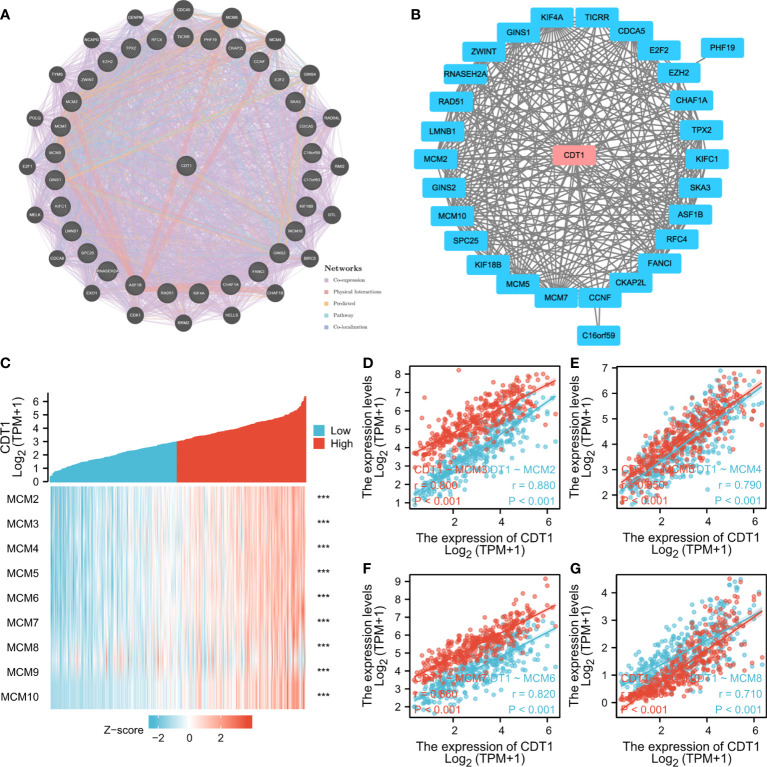
Figure 8.
(A, B) Interaction network of CDT1 and their most similar genes on GeneMANIA (A) and STRING (B) datasets. (C) Heatmap of the expression of MCM family genes in HCC samples with CDT1high and CDT1low expression. (D–G) Scatter plot results using Spearman correlation analysis between MCMs and CDT1 at the transcriptional level. ***p < 0.001.

