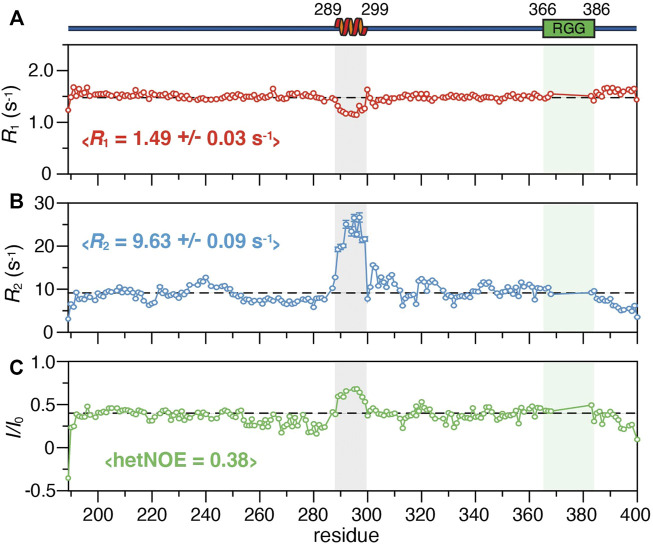
FIGURE 3.
15N relaxation parameters of SERBP1 189–400 including (A) R 1 and (B) R 2 rates, and (C) the 1H-15N heteronuclear NOE plotted against the protein sequence. The dashed lines represent the average value for each experiment, also indicated in brackets. A cartoon representation of the α-helix identified from chemical shift information and relative position of the RGG boxes (green) is shown above the plots. The shaded boxes align the helical region and RGG box over all panels.

