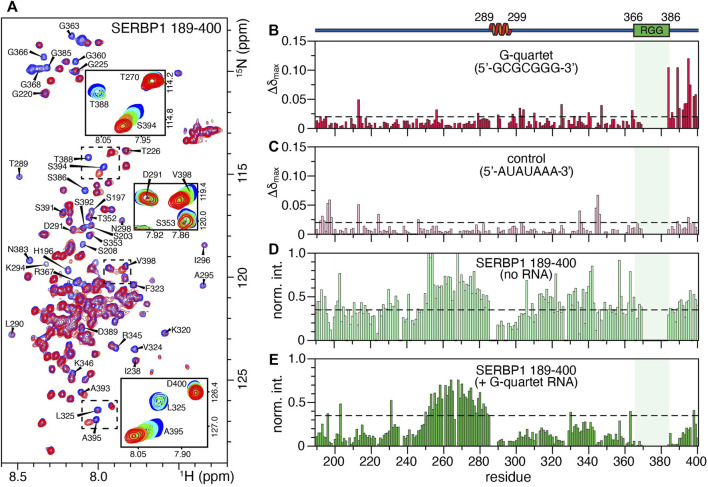
FIGURE 5.
Binding of SERBP1 189–400 to a 7-mer RNA oligonucleotide measured by chemical shift perturbations (CSP). (A) Overlay of the 1H,15N-HSQC spectra of SERBP1 in absence (blue) and presence (red) of 1:1.6 molar ratio of the 5′-GCGCGGG-3′ RNA 7-mer. Only the two titration points are shown to highlight the broadening of glycine residues observed upon addition of RNA ligand. The insets show the full titration series of peaks that shift significantly. A cartoon representation of the α-helix identified from chemical shift information and relative position of the RGG boxes (green) is shown above the plots. The shaded box aligns the RGG box over all panels. (B) Maximum CSP (Δδmax) induced by the RNA G-quartet ligand binding plotted against SERBP1 189–400 sequence. The dashed line represents the mean standard deviation of Δδmax for all peaks, shifts above this threshold are considered significant. (C) Maximum CSP (Δδmax) of a negative control RNA ligand (5′-AUAUAAA-3′) plotted against SERBP1 189–400 sequence. The dashed line represents the mean standard deviation of Δδmax for all peaks. Normalized intensities of the 1H,15N-HSQC peaks of SERBP1 189–400 plotted as a function of the protein sequence, in (D) the absence and (E) presence of 1:1.6 molar ratio of protein to the RNA 7-mer G-quartet ligand. Dashed lines are the same in both panels and represent the average intensity of SERBP1 peaks in the absence of RNA.

