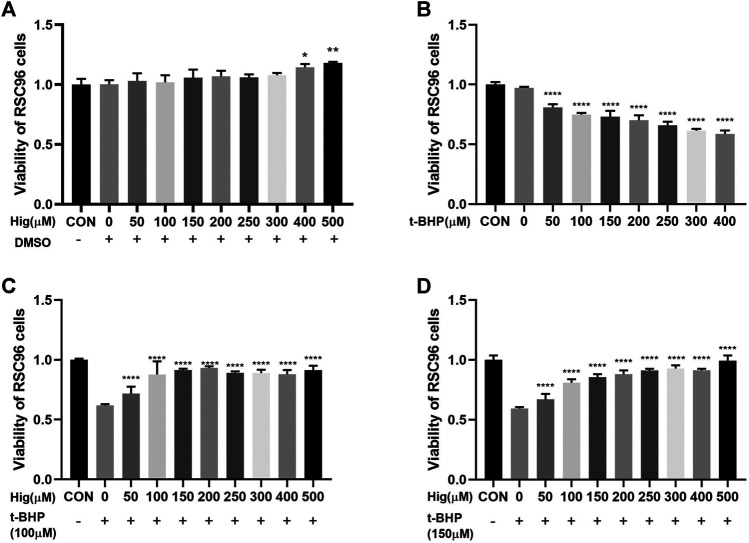
FIGURE 1.
Cell viability of Hig and t-BHP treatment. (A) CCK-8 detected the cell viability of RSC96 treated with 50, 100, 150, 200, 250, 300, 400, and 500 µM Hig for 12 h. A DMSO control group was set up to exclude the potential cell cytotoxicity of DMSO. (B) CCK-8 detected the cell viability of RSC96 treated with 50, 100, 150, 200, 250, 300, and 400 µM t-BHP for 2 h. (C) RSC96 was pretreated with 50, 100, 150, 200, 250, 300, 400, and 500 µM Hig for 12 h and then, respectively, exposed to 100 µM t-BHP for 2 h. (D) RSC96 was pretreated with 50, 100, 150, 200, 250, 300, 400, and 500 µM Hig for 12 h and then, respectively, exposed to 150 µM t-BHP for 2 h. CCK-8 was used to assess cell viability. The results are presented as mean ± SEM, n = 3. *p < 0.05, **p < 0.01, and ****p < 0.0001 vs. the control group.

