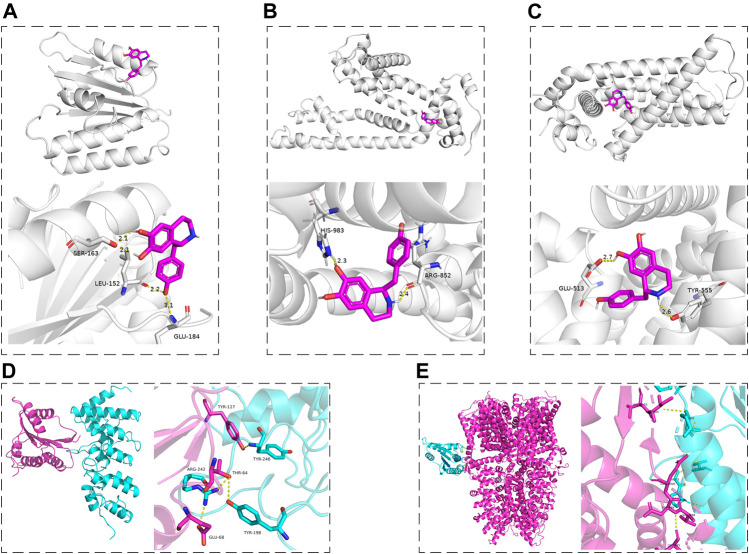
FIGURE 10.
The molecular docking maps. (A–C) The three-dimensional structure of Hig combined with Nox2, TRPA1, and TRPV1, respectively. (D, E) The schematic diagram of the optimal complex in Nox2-TRPV1 and Nox2-TRPA1 protein docking. The dashed line indicated the hydrogen bond formed between Hig and amino acid residues and the length of the hydrogen bond.

