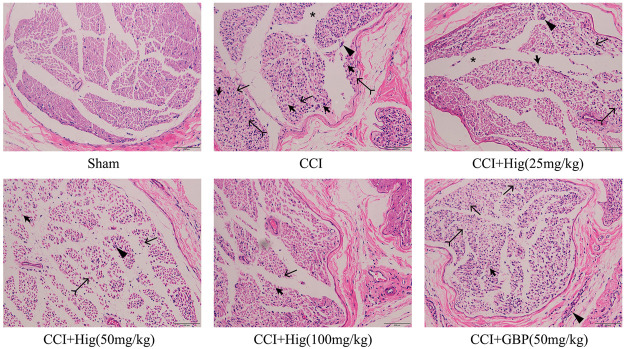
FIGURE 6.
The typical pathological images of DRG tissue in CCI rats. Thick arrow, thin arrow, bifid arrow, triangle arrow, and star symbols illustrate Schwann cell (SC) nuclei, myelin vacuolation, changes of axoplasm, inflammatory cell infiltration, and wide separation between the nerve fibers, respectively. Scar bar = 200 µm.

