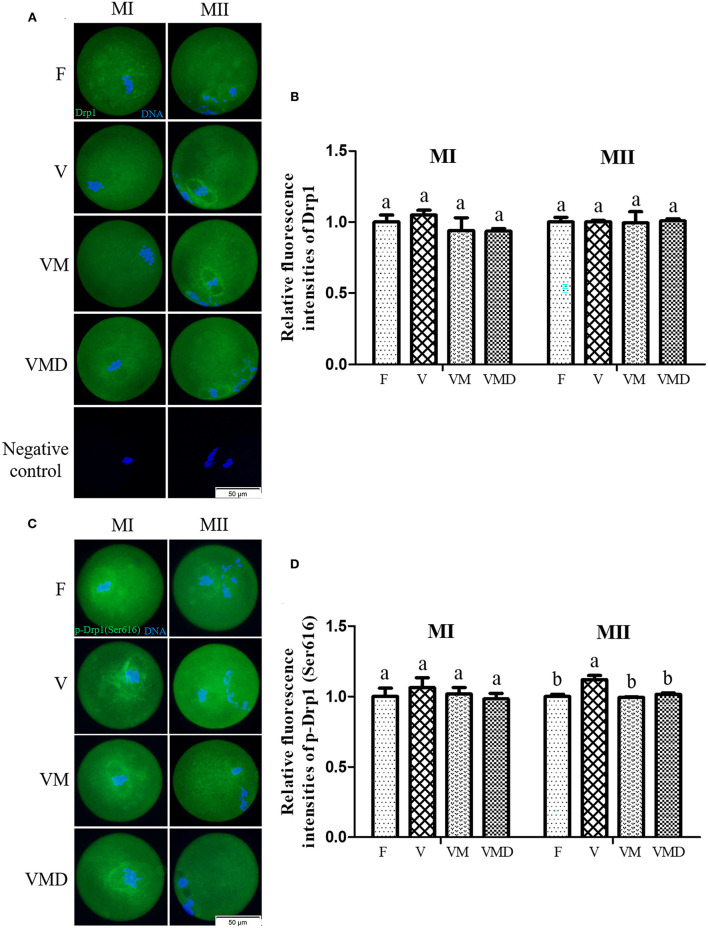
Figure 2.
Effects of melatonin on Drp1 activity during in vitro culture of vitrified-warmed mouse GV oocytes. (A) Representative images of Drp1 in mouse MI and MII oocytes. Scale bar, 50 μm. (B) The fluorescence intensity of Drp1 was recorded using ImageJ software. In total, n = 174 MI oocytes (F: n = 45; V: n = 42; VM: n = 45; VMD: n = 42) and n = 147 MII oocytes (F: n = 39; V: n = 40; VM: n = 35; VMD: n = 33) were used in this assay. (C) Representative images of p-Drp1 (Ser616) in mouse MI and MII oocytes. Scale bar, 50 μm. (D) Fluorescence intensity of p-Drp1 (Ser616) was recorded using ImageJ software. In total, n = 154 MI oocytes (F: n = 36; V: n = 40; VM: n = 35; VMD: n = 43) and n = 150 MII oocytes (F: n = 40; V: n = 38; VM: n = 40; VMD: n = 32) were used in this assay. Data are presented as mean ± SEM of three independent experiments. Groups without a common superscript are significantly different (P < 0.05). The four experimental groups: Fresh control (F), vitrification (V), vitrification + MT (VM), and vitrification + Mdivi-1 (VMD). MI, metaphase I; MII, metaphase II.

